Not everyone will have access to the IQ Server or any of the integrated enforcement points, and in turn, any of the associated reports. However, certain individuals or teams would likely still benefit from the information the Application Composition Report provides. Even if that’s not your particular situation, you may reach a point where you would like to produce an archive of a Application Composition Report for historical and audit purposes. Given this need, every report you produce can be converted into a PDF.
Though the information presented in both the web application and the PDF are nearly identical, there are a few difference, mainly formed out of the contrasting visual and layout capabilities of a web application versus PDF. Below, we’ll discuss how to create this PDF version as well as highlight some of the differences between the two.
With the Application Composition Report open, find the set of blue icons in the top right. While the
first icon is related to reevaluating the report, the button on the right
allows you to create a PDF version of the report. Simply, click on this button
![]() and your browser
will prompt you to download a PDF version of the report.
and your browser
will prompt you to download a PDF version of the report.
|
|
|
|
The report filename will be unique each time you use the button. However,
in general the report filename will use the following pattern:
|
The information provided by the PDF is identical to the information that is provided within the Application Composition Report in the application user interface. This includes the Summary, Policy, Security Issues, and License Analysis tabs. Within the PDF, the order of information is presented top to bottom, following the logic of the report tabs from left to right. With the exception of the first page, which provides the Summary, each section has a label to indicate the corresponding tab of the Application Composition Report:
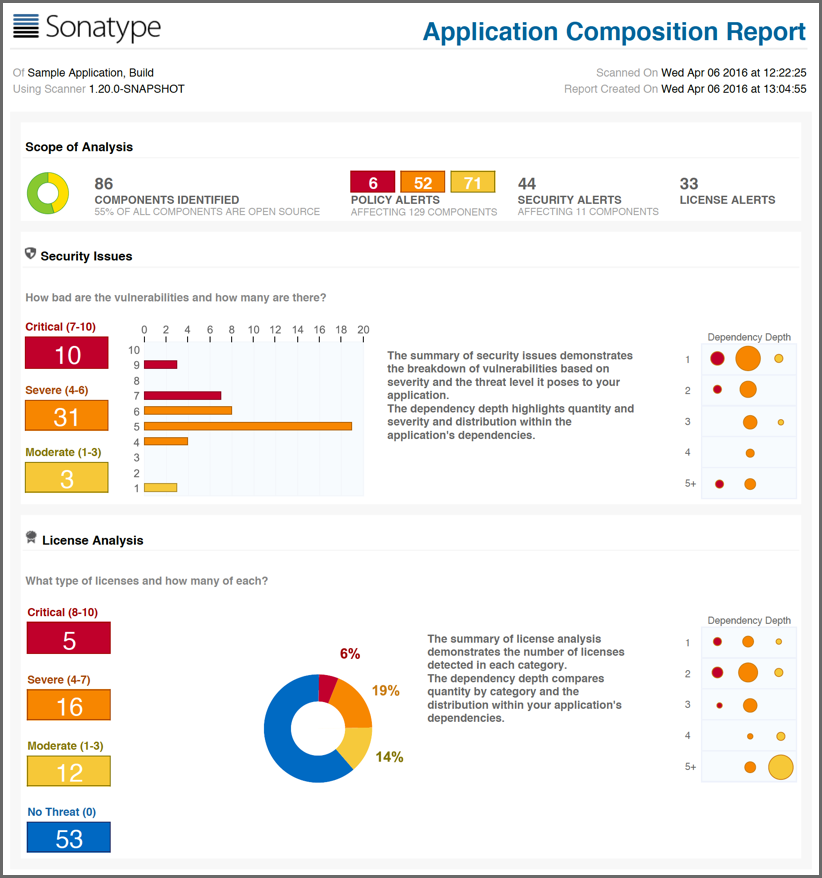
Summary. The summary section is identical to the HTML version of the report and visible in Figure 12.44, “Summary Section of the Application Composition Report in PDF Format”
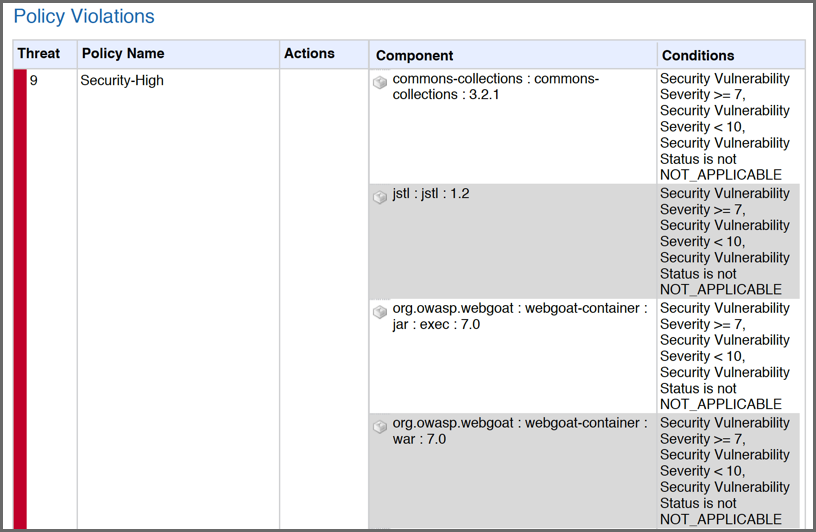
Policy Violations. The Policy Violations section as visible in Figure 12.45, “Policy Violations Section of the Application Composition Report in PDF Format” displays the details for all scanned components. This matches the data displayed in the Policy tab of the Component Information Panel (CIP). It should be noted, that depending on the number of violations in your application, this section could be very long.
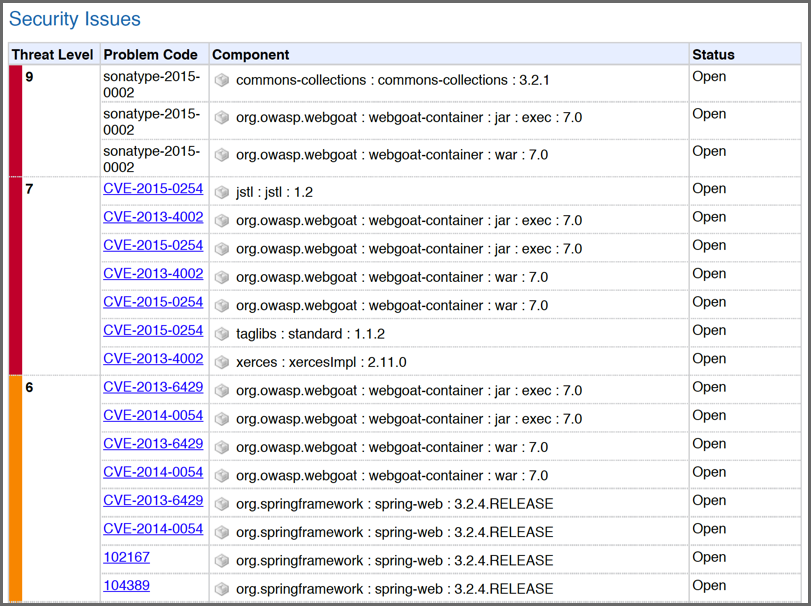
Security Issues. The Security Issues section displays a breakdown of all security issues found in the scan of the application, matching what is displayed in the HTML version of the report. An example is available in Figure 12.46, “Security Issues Section of the Application Composition Report in PDF Format”
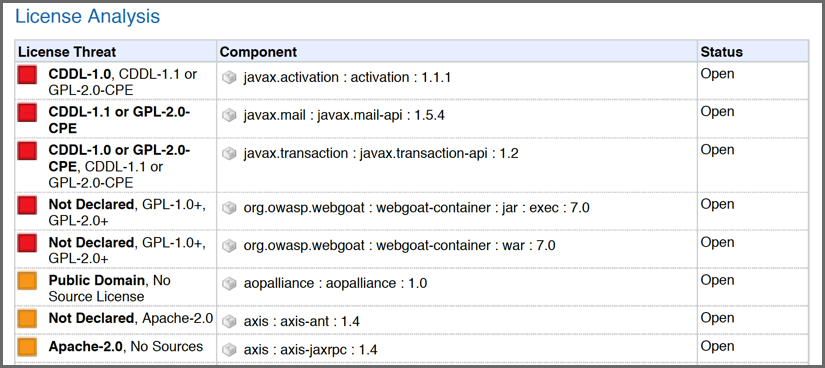
License Analysis. The License Analysis section displays a breakdown of all license issues found in the scan of the application, matching what is displayed in the HTML version of the report. It should be noted that depending on your license threat groups, and license assignments, this section of the report could be very long. A short example is displayed in Figure 12.47, “License Analysis Section of the Application Composition Report in PDF Format”.
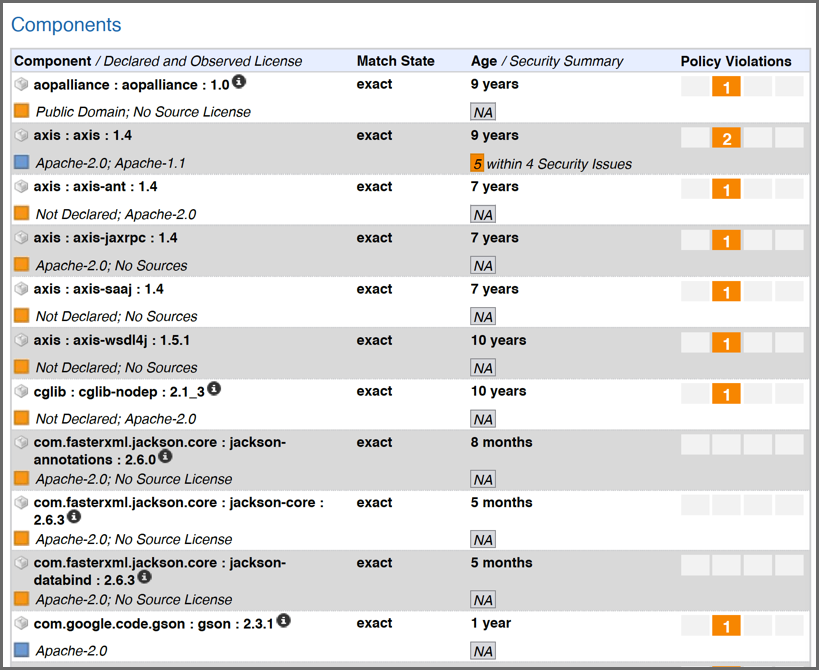
Components. As mentioned above, this section brings together information from all the others. It displays the highest security issue identified (and the associated CVS Score), any declared and/or observed licenses (and the highest threat level of the associated), the match state, age, and the policy violation counts for each threat level band (red, orange, yellow, and blue) for each component. An example is displayed in Figure 12.48, “Components Section of the Application Composition Report in PDF Format”. In most cases this section can be used as a detailed bill of materials.
|
|
|
|
In some cases a URL for the project is provided. This is indicated by an
information icon |