
The CLM Book - Optimized Component Lifecycle Management with Sonatype CLM
The Application Composition Report provides the results of an evaluation of your application. The results are broken into three key categories:
- Policy Violations
- Security Vulnerabilities
- License Issues.
As mentioned previously, this will be the same report, whether you are using the stand-alone scanner, the CLM Maven plugin, the manual evaluation, or any of the integrated enforcement points (e.g. Sonatype CLM for CI, IDE, Nexus Pro).
Let’s take a look at how to access the report first.
|
|
|
|
Depending on the enforcement point, or the stage options you manually selected, your report may be listed under different stages in the Reporting area of the Sonatype CLM Server. For example, the default location for the stand alone scanner, is the build stage. |
No matter how the scan was performed, all reports reside on the Sonatype CLM Server and are automatically associated with the corresponding application (via the application identifier). However, there are two distinct ways to access the Application Composition reports.
- Via the Reports Area
-
When you log into the Sonatype CLM Server the Dashboard is displayed by default. Click the Reports icon
 .
If multiple applications have been scanned, you will see all of them here.
.
If multiple applications have been scanned, you will see all of them here.
![[Note]](images/icons/note.png)
You will need to be a member of at least the developer group for the application you wish to see a report for.
![[Important]](images/icons/important.png)
Users of Nexus CLM Edition do not have access to the Sonatype CLM Dashboard. Because of this, these users will not be taken to the dashboard after logging in, nor will they see the dashboard icon. Rather, the reports area will display by default.
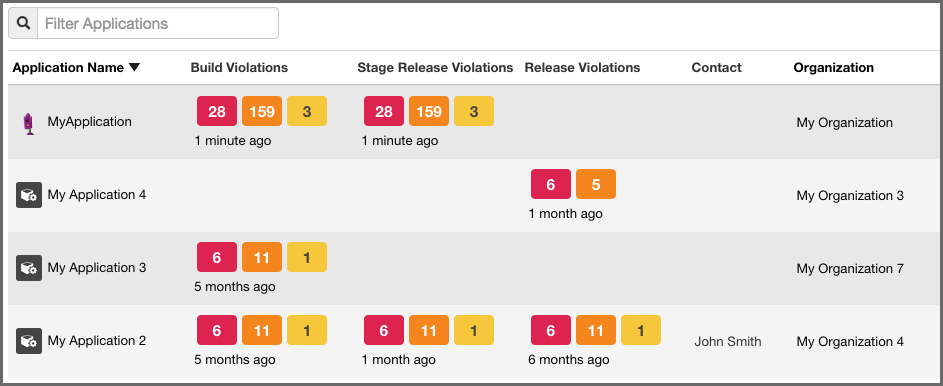
Each application has a separate row with columns for:
- Application Name
- Violations (by stage)
- Contact
-
Organization (for the corresponding application)
Each Violation column contains a Violation Summary (total counts for Critical, Severe and Moderate policy violations). In addition, the time the last report was generated (e.g. 2 minutes ago) is provided.
To access the Application Composition report, click the Violation Summary for the corresponding application and stage.
![[Tip]](images/icons/tip.png)
By default this view will be sorted alphabetically by the application name. In addition to the filter, you can also click on the application or organization columns to sort alphabetically ascending/descending.
- Via the Application Area
-
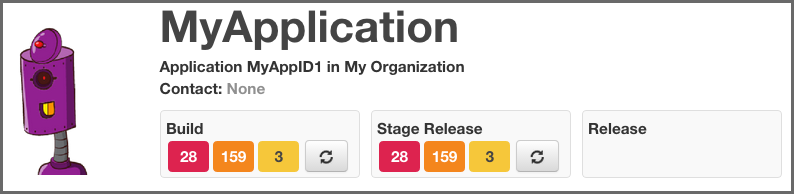
The Application area is the same place where you can manage policy for your application, reviewing policies unique to the application, as well as those inherited from the organization. Located just below the application identifier and organization, you will see three columns:
- Build
- Stage Release
- Release
These represent the Sonatype CLM stage where the report was generated for/from. For example, if you use the Sonatype CLM stand-alone scanner and don’t specify the CLM Stage, it will default to build. When your scan completes and the report is uploaded, it would appear below Build. This is highlighted in Figure 7.31, “Application Area”.
At first glance, you may be surprised at what you see. If you expected an application to have no issues, and now see it has a great deal, don’t get upset… yet.
In many cases, a policy can be too stringent or may indicate issues that are not exactly applicable to your application. For example, you may have a security issue that would only affect applications exposed to the public, while your application is for internal use only. Another great example is a license that constrains your code in the event you intend to sell the application.
With that worry out of the way, let’s take a look at what’s actually in each report.
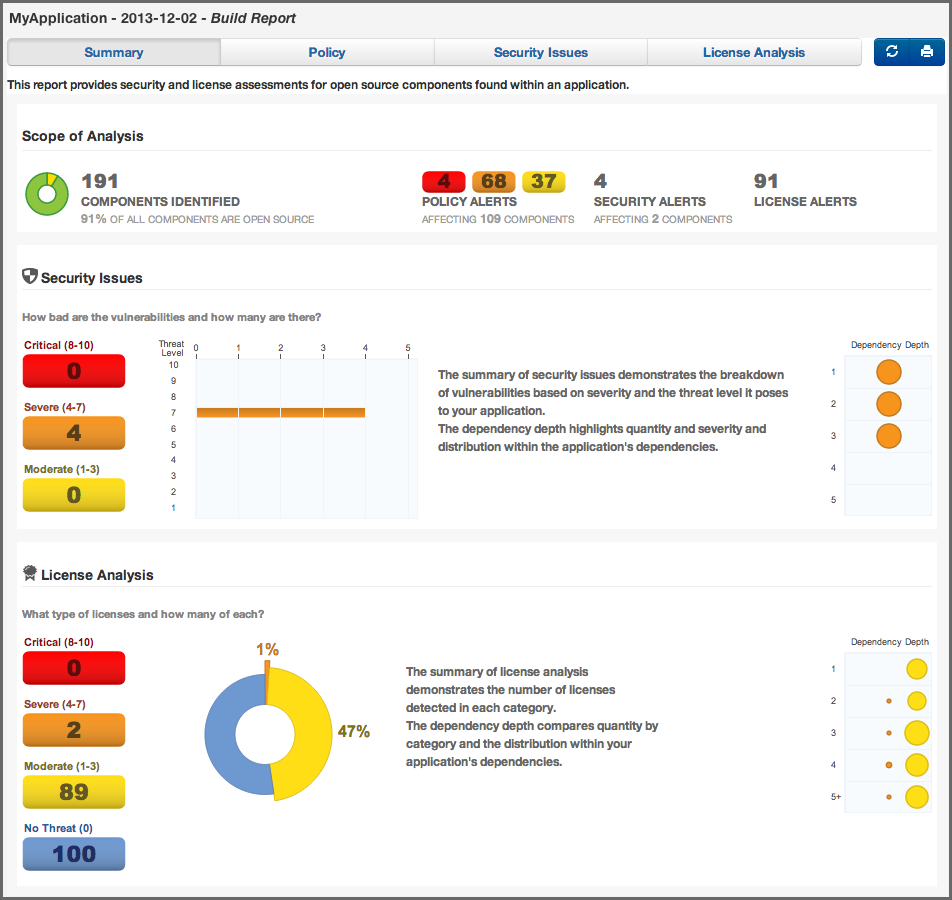
The Summary tab of the report shows a breakdown of what was found. This includes counts for policy violations, security vulnerabilities and license-related issues.
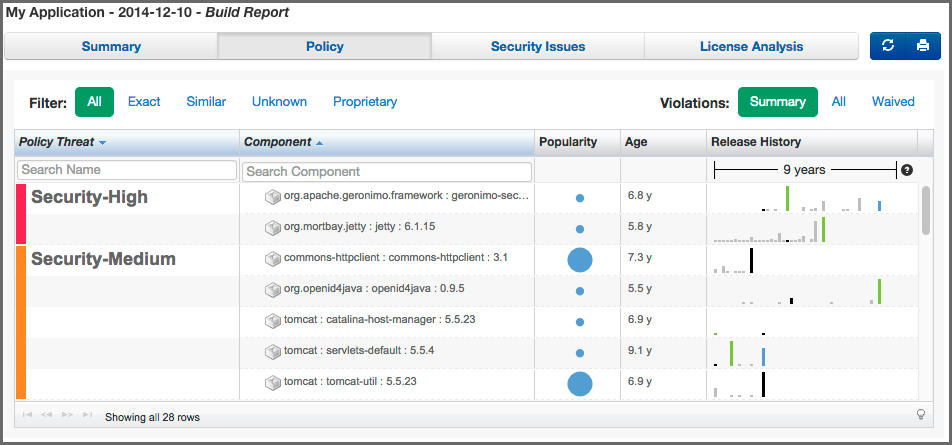
The Policy tab provides a list of all components that were found in your application. An example is displayed in Figure 7.33, “Policy Tab of an Application Composition Report”. The list of components is ordered by the level of the threat violation that has been assigned to the policy. In instances where a component has violated multiple policies, only the violation with the highest threat is displayed.
To view the other violations you can use the component information panel (described below), or change what is displayed using the Violations filter on the right. This will allow you to see all violations for your component, though that may result in the appearance of duplicated components.
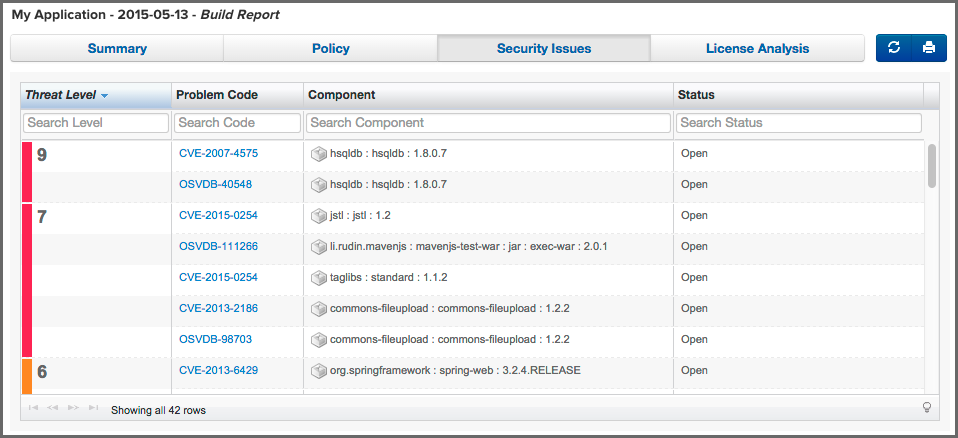
The Security Issues tab displayed in Figure 7.34, “Security Issues Tab of an Application Composition Report” displays all components containing security issues.
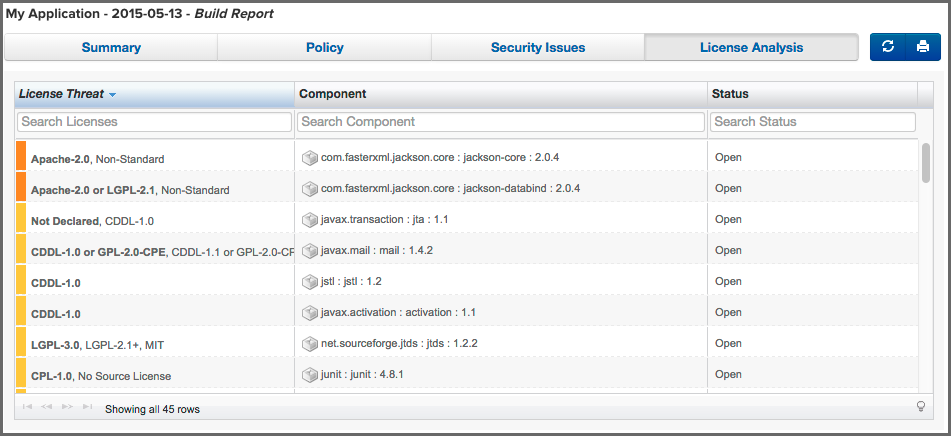
The License Analysis tab displayed in Figure 7.35, “License Analysis Tab of an Application Composition Report” displays all components and the determined details about their license(s).
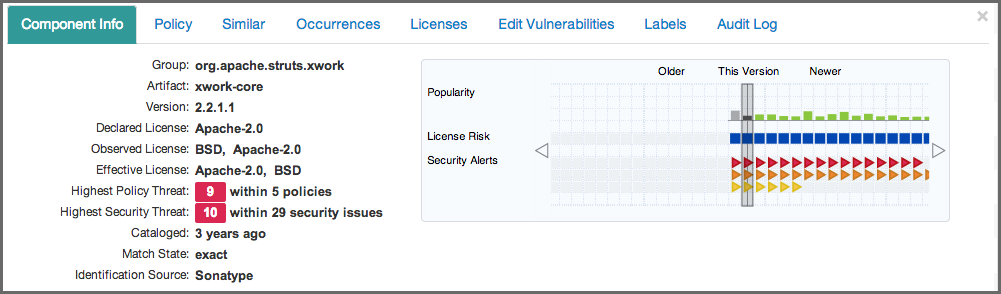
In the Policy, the Security Issues as well as the License Analysis tabs, you can get access to more information about a particular component by clicking on a row in the table representing the component you are interested. The Component Information Panel CIP, with an example displayed in Figure 7.36, “Component Information Panel CIP for a Specific Component” shows more specific information about the component.
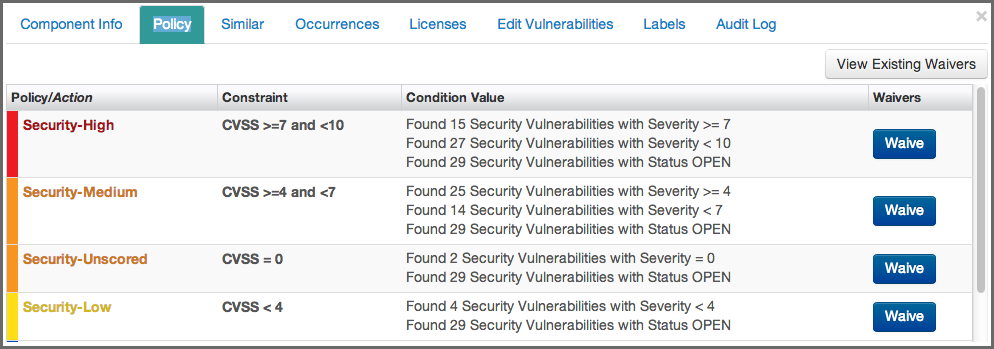
Clicking on the Policy header in the component information panel displays all policy violations for the selected component. As you can see from the example displayed in Figure 7.37, “Policy Section for a Specific Component Displayed on the Component Information Panel” the policies as well as the constraints and the condition values that triggered the policy violation are displayed.
A number of specifics used in the tabs and the panel are detailed in the following:
- Threat Level
-
We briefly mentioned above, that policy violations are organized by threat level. The threat level breakdown is as follows.
- Red / High (10 - 8) - Indicates a component with a severe threat, and should be treated seriously.
- Orange / Medium (7 - 5) - Indicates a component with a moderate threat, and should be treated seriously.'
- Yellow / Low (4 - 2) - Indicates a component with a low threat, and may not pose any serious threat to your application.
- Dark Blue / Informational (1) - Indicates that there is a very low threat, and you should just be aware of a possible issue.
- Light Blue / None (0) - Indicates that no policy has been violated by the component.
- Matching
- It’s likely that you started seeing an area that indicates matching. As a quick definition, matching employs a series of in-depth algorithms to determine if a component found in your application matches anything known to the Central Repository, or known to the Sonatype CLM Server. That’s right, through a claiming process and a proprietary component configuration, you can teach Sonatype CLM to recognize components it may not have otherwise.
- PDF Printing
- The application composition report can be printed to PDF simply by clicking the print icon located in the upper right corner of the report.
- Re-evaluation
- Eventually, when you begin to manage and modify policies, you may simply want to compare the results from the most recent report with your policy modifications. The re-evaluate button, located to the left of the pdf/print icon will allow you to refresh the results without having to generate a whole new report.