A User Guide to Reports in Sonatype CLM
The Sonatype CLM Trending Report consists of several different sections:
- Policy and application overview
- Violation summary and trending
- Top component violations
- Component matching overview
The sections above are not labeled, but can be identified by different chart types and data that is presented to assist, each section has been highlighted below.
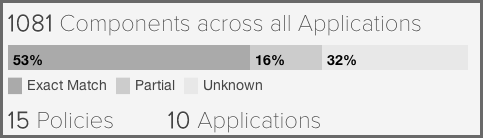
Policy and Application Overview. The policy and application overview section is located in the top left of the first page of the report. The first piece of information displayed is a total count of components found across all applications Sonatype CLM has scanned. Just below this count is a chart displaying the percentage of each type of match identified by Sonatype CLM.
- Exact Match
- Sonatype CLM has matched a component exactly to the one in your application.
- Partial Match
- Sonatype CLM has found more than one component that may match the component in your application.
- Unknown Match
- Sonatype CLM has been unable to identify the component in your application.
Finally, a total count of policies and applications configured in the Sonatype CLM server is given.
Listed below this information are Threat Levels and the list of applications representing the Highest Risk.
Violations Summary and Trending. The violations summary and trending section consists of the Threat Levels display, the list of Highest Risk applications, the Violations counts and the break down by policy type as well as the list of policies and the violations trending.
The Threat Levels chart displayed in Figure 10.4, “Threat Levels” shows the total number of policy violations for the severity levels of High, Medium, Low and None.

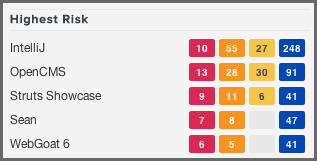
The Highest Risk section displayed in Figure 10.5, “Highest Risk Applications” lists the five applications posing the highest risk as determined by the number of policy violations for the different severity levels with actual number of violations displayed for each application.
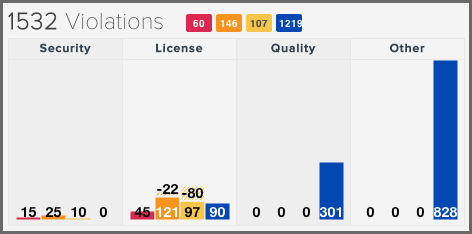
The Violations summary report displayed in Figure 10.6, “Violation Summary by Policy Type” lists the total number of violations and breaks it down per severity as well as per policy type. While policies do not inherently have a type Sonatype CLM assigns a type based on conditions included within the policy using these rules:
- If there are any security conditions, it is considered a security type policy.
- If there are any license conditions, it is considered a license type policy.
- If there are any age or popularity conditions, it is considered a quality type policy.
- If there are any conditions not mentioned above, it is considered an other type policy.
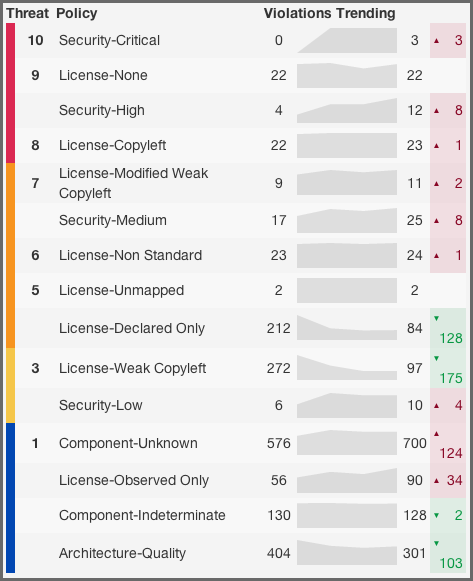
The display of the Violation Summary by Policy in Figure 10.7, “Violation Summary by Policy” shows all policies as well as the total count of violations, and their increase / decrease (trending) over time. The columns in the report are Threat Level, Policy Name, Starting Violation Count, Most Recent Violation Count and Violation Change.
Top Component Violations. Starting at the top of the right column of the trending report, there are five charts highlighting the five components with the most violations:
- Top Violators
- Security Policy Violators
- License Policy Violators
- Quality Policy Violators
- Other Policies
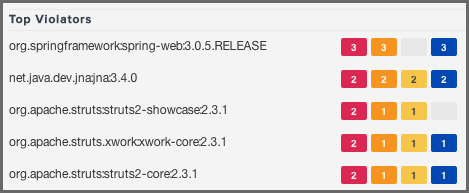
All these reports are displaying the component identifier and the violations count for the severity levels with an example visible in Figure 10.8, “Top Violators”.
Excluding the Top Violators chart, which is simply the five components with the most violations across all policy types, the remaining charts use the calculation of risk outlined in Understanding Risk.
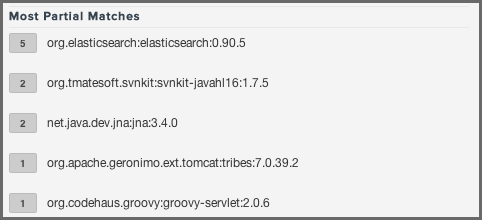
The list of Most Partial Matches displayed in Figure 10.9, “Partial Matches”show s the top five components that have been indicated as being matched partially by Sonatype CLM, as well as the number of partial matches that exists for each component.
A partial match in an application isn’t necessarily a bad thing. In many cases, it’s simply a case of the component getting rebuilt, and Sonatype CLM no longer can match it exactly to the version we have. However, this can also be a sign that malicious content may have made it into your application. For this reason, investigating partial matched components and understanding the reason for the partial, rather than exact match is an important aspect to investigate.