
Optimized Component Lifecycle Management with Sonatype CLM
The Application Composition Report represents the health of your application. Ultimately, it serves as a snapshot, a point-in-time report representing risk associated with component usage for a specific application. The report includes information on how the application complies with the policies your team, or business, has established. In many ways, it’s the final connector between policies and the components of your application.

When looking at the report the first time, it can be daunting. If you see tons of red, you may quickly be dismayed. Or perhaps, you don’t see enough red and are worried in a different way. These feelings aren’t uncommon, and they reveal another important aspect of the Application Composition Report - it contains a lot of information.
More than just reporting the violations components in your application have triggered, it also provides a way to improve policy management. These reports don’t show false positives… ever. If there is a red ,severe policy violation that should really be much lower, communicate back with the team in charge of managing the policies. In fact, of all its uses, the ability to communicate findings to a wide audience is perhaps the most important task of this report.
In this section, we will provide an overview of the various areas of the report and therefore serve as an robust introduction.
For those of you that prefer bulleted lists, here’s what we’ll cover in this guide:
- Accessing the application composition report
- Overview of the four tabs and the component list
- Importance of component and violation counts
- Various policy, security, and license related data points
- Printing a bill of materials
- Overview of component information panel (CIP)
This section is meant to provide a detailed look at how to access the application composition report, as well as what information is provided.
You can access the application composition report in your Sonatype CLM Server in two ways:
- Via the Reporting Area
-
The Reports area, which is displayed by default when you log in to the Sonatype CLM Server, can also be accessed by clicking on the Reporting icon
 . These
steps outline that process:
. These
steps outline that process:
- Log into your Sonatype CLM server with a user account that has proper permissions to view a report for a specific application (at least a member of the developer group for the application would be required).
-
The Reporting area will be displayed. In case you are in a different section
of the application, you can always click on the Reporting icon
to return to the
Reporting area.
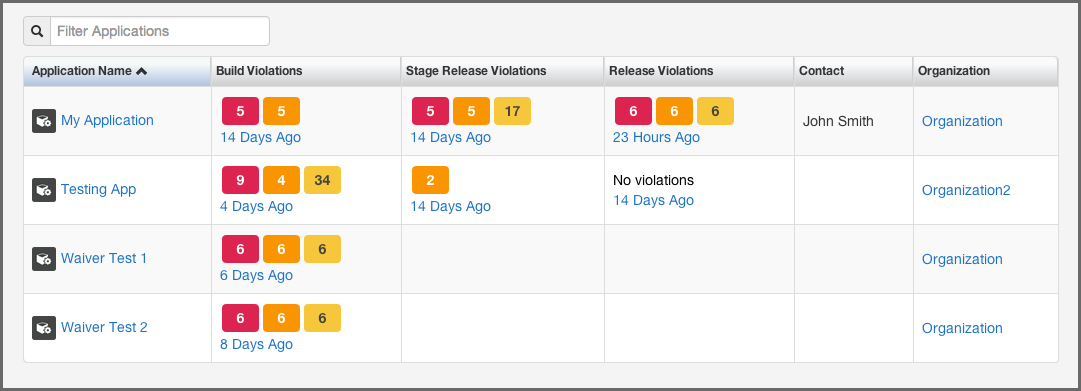
- You will see two menu items on the left, Violations and Trending. You want to click on Violations, if it is not already selected, to access the Application Composition Report. Applications you have permission to view will be displayed, with each row representing a single application. You can use the filter to reduce the applications displayed (simply enter a few letters of an organization or application).
You will notice, that there are several columns:
- Application Name - links to the Application Management Area for the specific application.
- Build, Stage Release, and Release Violations - these three columns display the violation counts for the most recent evaluations. The counts are broken down by Critical, Severe, and Moderate with text indicating the time (e.g. 2 minutes ago) of the most recent evaluation.
- Contact - this is the contact for the corresponding application.
-
Organization - links to the parent organization for the corresponding application.
- Click the the contents in the violations column to access the report.
Tip
By default this view will be sorted alphabetically by the application name. In addition to the filter, you can also click on the application or organization columns to sort alphabetically ascending/descending.
- Via the Application Area
-
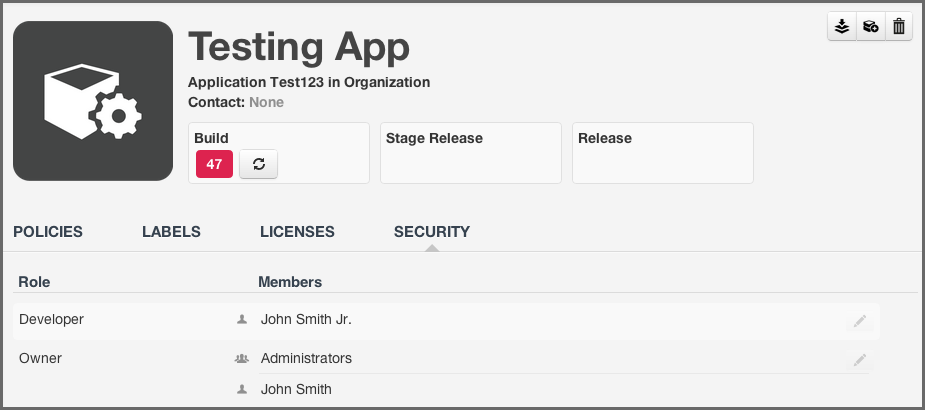
The Application area is the same place where you can manage policy for your application, reviewing policies unique to the application, as well as those inherited from the organization. Located just below the application identifier and organization, you will see three columns:
- Build
- Stage Release
- Release
These represent the Sonatype CLM stage where the report was generated for/from. For example, if you use the Sonatype CLM stand-alone scanner and don’t specify the CLM Stage, it will default to build. When your scan completes and the report is uploaded, it would appear below Build. This is highlighted in Figure 4.3, “Application Area”
Note
Reports can also be accessed via enforcement point tools like Sonatype CLM for CI, and Nexus Pro - Sonatype CLM Edition. However, in each of the tools, they will connect to the Sonatype CLM Server.
When you look at the application composition report for the first time, you will likely notice the four tabs:
- Summary
- Policy
- Security Issues
- License Analysis

These tabs represent the basic navigation for the report, and serve to divide information into specific sections. In a sense, the name of each tab represents the theme of the data that will be displayed.
The Summary tab displays a summary of violation, security, and license risk information for components in your application and provides a good first overview. The Policy tab displays violation data for components in your application. The Security tab displays security related risk for components in your application. And the License Analysis tab displays license-related data for components in your application.
We’ll cover each of these in a bit more detail below. However, it’s important to first understand a little bit about what a report represents and basic sets of it contains.
In general, each report…
- Corresponds to a single, specific application, indicating the application name, date of the report, and the stage the scan took place in.
- Includes components found during a scan of the application, in most cases, including any dependencies.
- Records violations linked to an application’s policies, or the policies inherited from the application’s organization.
- Displays available security information for any components found matching components in the Central Repository.
- Displays available license information for any components found to exactly, or partially, match components in the Central Repository, as well as any data recorded manually (e.g. through the claiming process).
- Distinguishes between, external, proprietary and internally identified/claimed components.
Now that you know forms the basis of the report, let’s take a look at each tab individually.
The Summary tab is always the first section of the report displayed. It is broken into three sections:
- Scope of Analysis
-
This section shows counts, giving you an idea of the volume of components that were found during the scan. It also gives a breakdown of those that were identified, including a specific percentage that is represented by open source components. In addition to these numbers, you will also see:
- A count of components with policy violations, displayed by threat level. Only the most severe violation for each component is counted.
- The total number of security alerts found, and the number of affected components.
- The total number of license alerts. Each license alert corresponds to a single component.
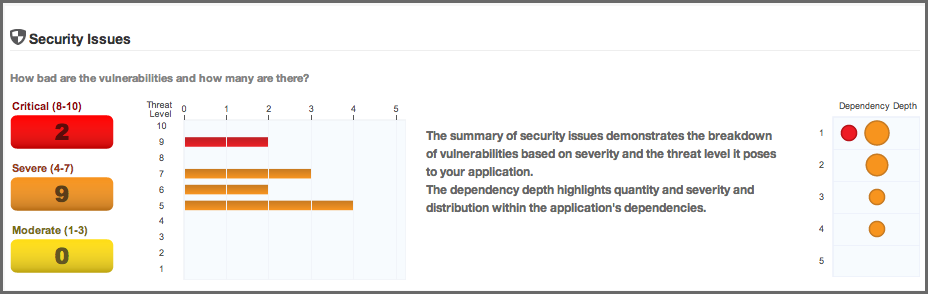
- Security Issues
- The Security Issues section provides three visualizations. The first visualization displays the number of security issues by their particular Common Vulnerability Scoring System CVSS score, breaking the issues into three threat levels - Critical, Severe and Moderate.
Next to this raw count, the same numbers are represented in a bar graph to help distinguish the relative impact for each threat level.
Finally, a dependency depth chart shows where the security issues occur, relative to how many there are, indicated by the size of the circles, as well as what level of dependency they are found in.
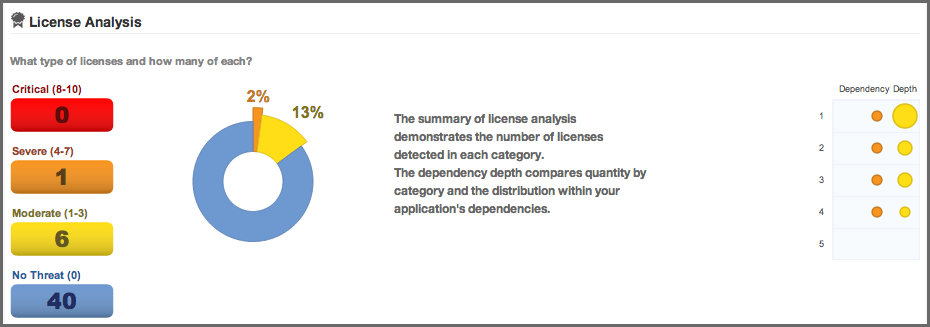
- License Analysis
- As with Security, the License Analysis section breaks the data into four threat level categories. However, these threat levels do not come from an external source, but rather the user-configurable license threat groups that are managed via the CLM Server.
There are four threat level categories:
- Critical (Copyleft)
- Severe (Non-Standard)
- Moderate (Weak Copyleft)
- No Threat (Liberal)
These categories used in the report are static and not not configurable.
The first counts that are displayed represent the total number of licenses found in each threat level. Next to this list, a graph indicates percentage of licenses in each threat level category, compared to the total number of licenses found. Finally, a dependency depth chart indicates the volume of licenses found at each dependency level, as well as the color corresponding to the threat level.
The Policy tab displays a list of all components found during the scan of the application. By default components are ordered by their worst policy violation. This is an important distinction, because a component may have more than one violation, and the threat level severity for those violations could vary. If you wish to see all violations there are two options, using the Violation Filter, or the Component Information Panel (CIP). In this guide we’ll discuss both options. However, below we have highlighted the available filters.

- Filter
-
The filter lists five categories:
- All (default)
- Exact
- Similar
- Unknown
- Proprietary
In addition to the main set of filters, you can also filter by violations, including those that have been waived. The available options include:
- Summary (default)
- All
- Waived
Clicking on any of these will change the components in the list. We’ll discuss each of these in further detail in the sections corresponding to component matching, claiming components, and waiving components sections.
- Component List
- The list of components, below the filter, displays the Threat level posed by the components with their identifying Coordinates. The Threat Level column displays the name of the worst violated policy for the component and the severity using a colored bar. The Coordinates column uses group identifier, artifact identifier and version separated by colons.
In addition the list displays the Popularity and the Age of the component in the Central Repository in separate columns. The Release History is displayed in a visualization that includes the most popular version, the most recent version, your version and any other available versions in a timeline.
By clicking on the column header, the list of components can be sorted. If you are looking for a specific policy, or component, you can use the search fields located at the top of each of those columns, directly below the header.
Clicking on a row for a component in list displays the Component Information Panel (CIP), which we will discuss in Section 4.2.8, “The Component Information Panel (CIP)”.
The important thing to remember about the Security Issues tab is that information displayed there is related specifically to security vulnerabilities data that has been collected by Sonatype. This data however, is separate from policy violations, which are based on policies that you have created (or imported), and are displayed on the Policy tab. That is, you could certainly have a situation where there is a security vulnerability, and no policy violation. Because of this, it is important to treat them independently.
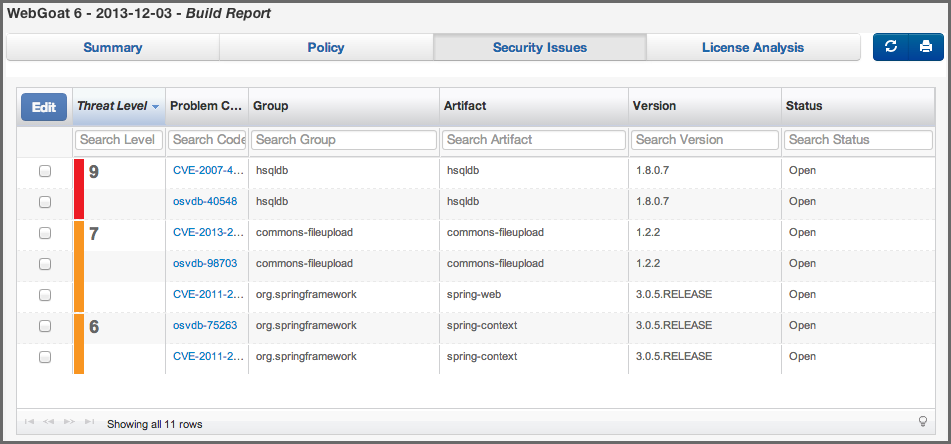
The way components are displayed is actually quite different as well. In the Security Issues tab, only those components with a security vulnerability are displayed. The data provided for each component is broken into several columns:
- Threat Level
- Problem Code
- Group
- Artifact
- Version
- Status
By default the list of components with security vulnerabilities is organized by threat level. This helps you isolate the most critical issues you need to address. However, you may notice that components in this list are repeated. This is because a component may have more than one security vulnerability, and those vulnerabilities in fact may have different scores, thus different threat levels.
To sort the list, simply click the corresponding header. For example, if we wanted to sort by artifact identifier, finding a component with multiple vulnerabilities, we would simply click on the Artifact column. Additionally, you can search for a specific component by typing in the search field located directly below each header.
Note
You might have noticed the status column, and the big blue Edit button. It is used for changing the Status of a security vulnerability for a component selected in the list.
The License Analysis tab displays all identified components found in the application scan and their license threat details. Unknown components are not displayed. Similar to the security issues, a license threat does not necessarily correlate to a policy, and as such should be treated independently.
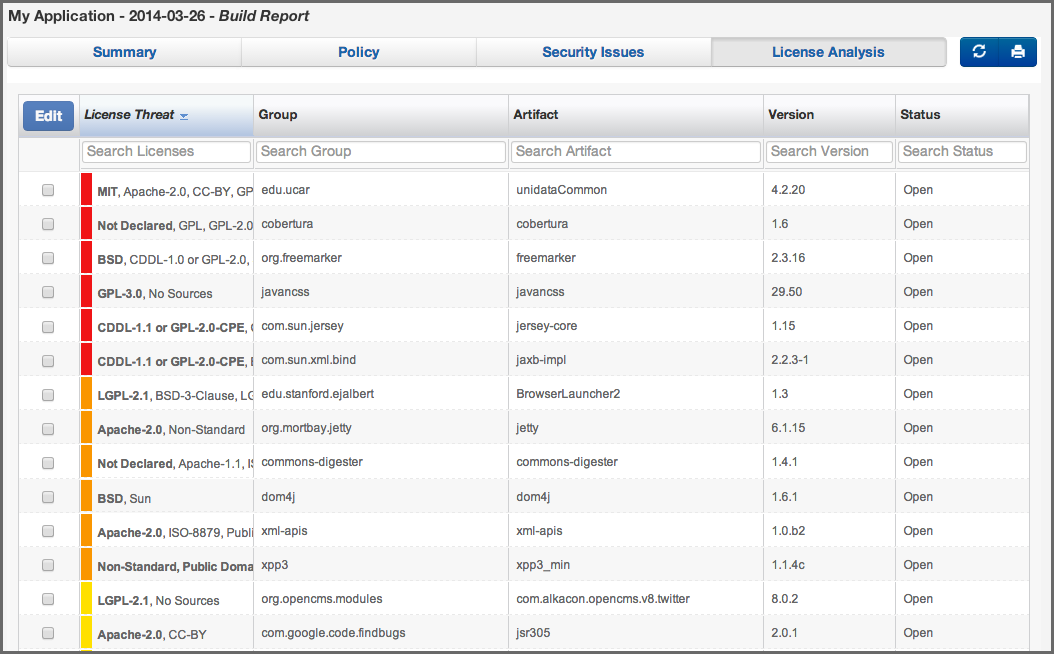
For each component listed, the license related data is displayed. This data is based on information collected during a scan. By default, components are listed based on the threat of the corresponding License Threat Group that identified license is in. However, like the other tabs, clicking on a column in list will sort the components by that column. Additionally, specific components can be isolated using the search located below each header. The columns displayed include:
- License Threat
- Group
- Artifact
- Version
- Status
Similar to the Security Issues tab, the Edit button allows you to change the Status for a specific component.
The top right corner of the report displays two buttons that give you access to refreshing the report as well as printing the report.
The refresh button on the left triggers a re-evaluation of the report. It will take the existing list of components in the report and reevaluate them against the your application policy.This comes in handy when you are making policy changes and want to see how that would affect the current data without having a to rerun a build.
The second icon on the right, the printer icon, allows you to create a PDF version of the report that is nearly identical to the HTML version. You can use this report for actual printing on paper, distribution to recipients without access to the CLM server or simply for archival purposes. And of course it also works as a great bill of materials for your application.
While these are both small elements, they can prove to be very useful.
In our previous sections, we briefly indicated that clicking on a specific component causes the Component Information Panel (CIP) to be displayed. We promised to discuss it further, and this section makes good on that promise.
The first thing you should notice, is that the CIP can be accessed for a component on the Policy, Security Issues, and License Analysis tabs. No matter which of these tabs you are on, simply click on the component, and the panel is displayed. Even better, the information displayed is the same, regardless of the tab in which you clicked on the component.
The CIP itself is divided into two areas. The top has a list of various sections, each providing more specific details and functionality related to the component. Below these sections, the panel will display information for the corresponding section. A brief description of each section is included below
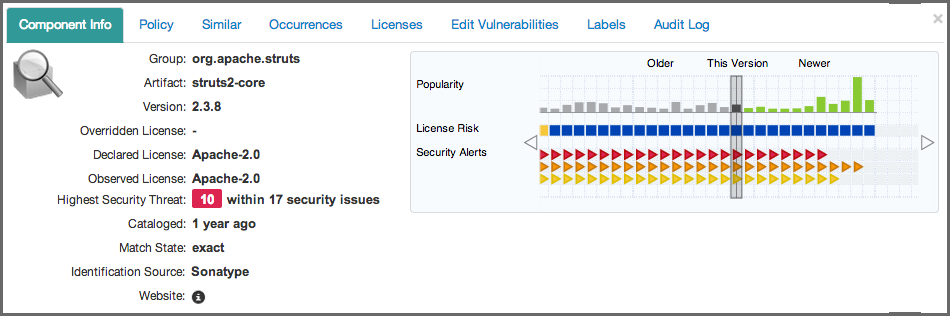
Component Info
- Overridden License
- If you have chosen a different license for the component, it will be displayed here. This could e.g. be the case if you have purchased a license for a component allowing distribution, while the component is originally GPL.
- Declared License
- Any license that has been declared by the author.
- Observed License
- Any license(s) found during the scan of the component’s source code.
- Group
- The group part of the GAV component identifier.
- Artifact
- The artifact part of the GAV component identifier.
- Version
- The version part of the GAV component identifier.
- Highest Policy Threat
- The highest threat level policy that has been violated, as well as the total number of violations.
- Highest Security Threat
- The highest threat level security issue and the total number of security issues.
- Cataloged
- The age of the component based on when it first was uploaded to the Central Repository.
- Match State
- How the component was matched (exact, similar, or unknown).
- Identification Source
- Whether a component is identified by Sonatype, or claimed during your own process.
- Website
- If available, an information icon providing a link to the project is displayed.
The graph itself is laid out like a grid, with each vertical piece representing a particular version. The selected version being identified by a vertical line. The information displayed in the graph includes:
- Popularity
- The popularity for each version is shown as a bar graph. the larger the graph the more popular the version.
- License Risk
- This will display the license risk based on the application that is selected, and the associated policy and/or license threat groups for that application. Use the application selector to change the application, and corresponding policies the component should be evaluated against.
- Security Alerts
- For each version, the highest security threat will be displayed by color, with the highest shown as red, and no marker indicating no threat.
Policy. The Policy section displayed in Figure 4.12, “CIP, Policy Section” has the details of any policy violations for the component. Here you can see the name of the policy that has been violated (and any action that was taken), the name of the constraint that has been violated, and the value that was found. While the Policy/Action and Constraint names are straight forward, the Condition Value may be a little confusing at first.
As we know from our other guides, a condition is simply the if part of an if/then statement. If a certain condition value is found which is equivalent to a condition being met, then the policy will be violated. E.g. if we have a policy that has a condition such that if a security vulnerability is found, our Condition Value column would indicate, Found x Security Vulnerabilities. In the same regard, Constraints are simply multiple conditions joined together.
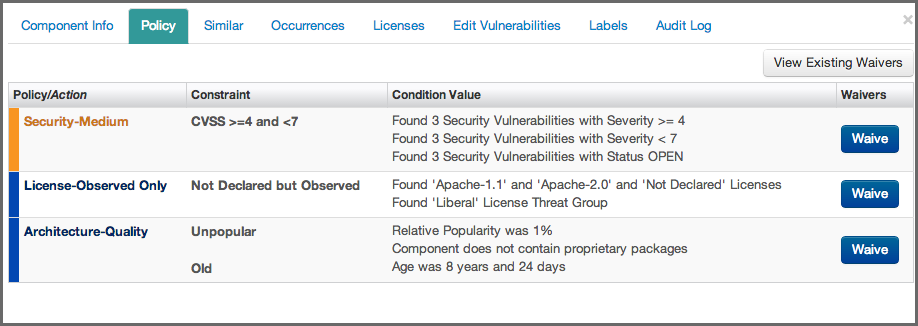
In addition to simply viewing the policy information details, a policy violation can also be waived in this section of the CIP using the Waive button.
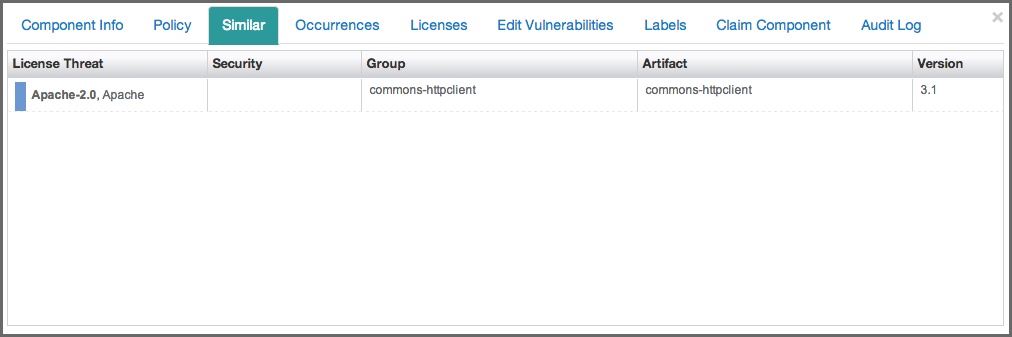
Similar. You likely have already noticed the Similar filter that is available on the Policy tab. These two are related, and both are a function of the matching algorithms that Sonatype CLM uses when scanning and identifying components. We won’t go into the details of matching at this time. So, for now, know that any components found to be similar to the selected component will be listed in the Similar section displayed in Figure 4.13, “CIP, Similar Section”. A similar component could for example be a component that a developer has built locally using the source code of an open source component with minor modifications or additions.
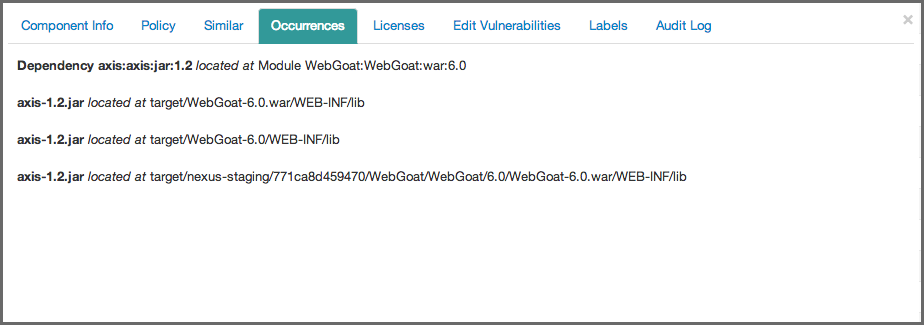
Occurrences. When a file is scanned, it has a filename and location where it was found. In some cases, it may have more than one filename and location. Either way, the path to the location(s), as well as the filename(s), of the component that was scanned is included in this section. In short, the Occurrences section displayed in Figure 4.14, “CIP, Occurrences Section” lists the file names and locations where the component was encountered. This section can be especially useful to detect accidental shipping of duplicate components archives or a misconfiguration of your actual report creation target e.g. you might be scanning the deployment archive (e.g. a war file) as well as the build output folder used to create the archive.
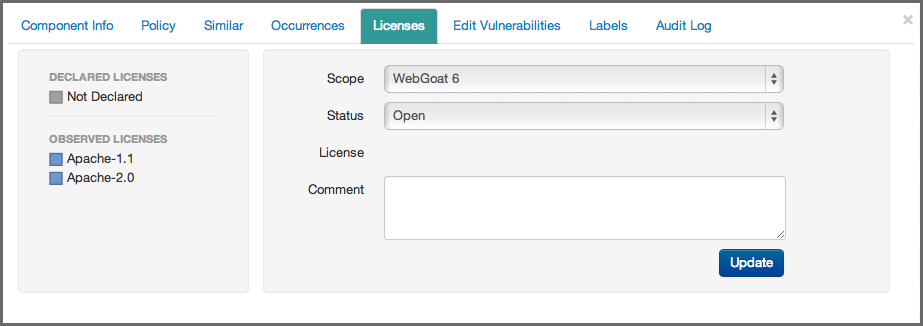
Licenses. The Licenses section displayed in Figure 4.15, “CIP, Licenses Section” is split into two areas. On the left, any licenses that were identified as declared by the author of the component, as well as any license found during the scan of the component source code are listed. On the right, is the license status area. This functionality directly correlates to the blue Edit button we mentioned in the License Analysis tab overview. It allows you to set the Status of the component license information.
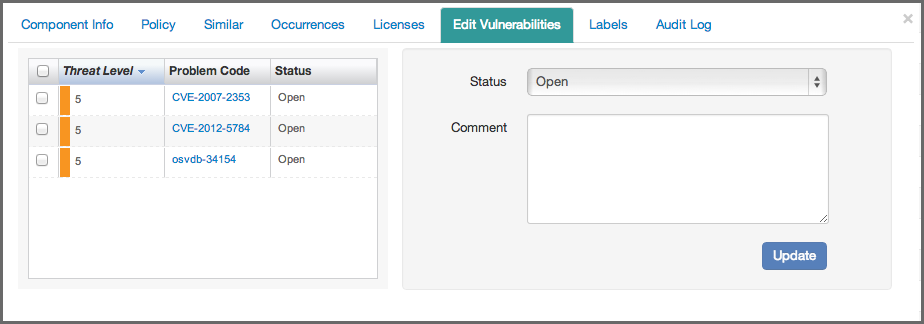
Edit Vulnerabilities. In much the same way as the Licenses section, Edit Vulnerabilities displayed in Figure 4.16, “CIP, Edit Vulnerabilities Section” is separated into two areas. On the left, all security vulnerabilities related to the component are displayed. On the right, the security vulnerability status area. This functionality, which we will discuss later, directly correlates to the blue Edit button we mentioned in the Security Issues tab.
Labels. Labels are discussed in more depth later in this guide. However, the important item to note here, is that the assignment of labels to a components is done in this section of the CIP displayed in Figure 4.17, “CIP, Labels Section”.

Claiming Components. The Claim Component section displayed in Figure 4.18, “CIP, Claim Component” is only available for unknown or similar component matches. During a scan, some components are identified as unknown or similar to components known by Sonatype CLM. Since we realize that in many cases, you actually recognize these components, we provide this section to claim these components.
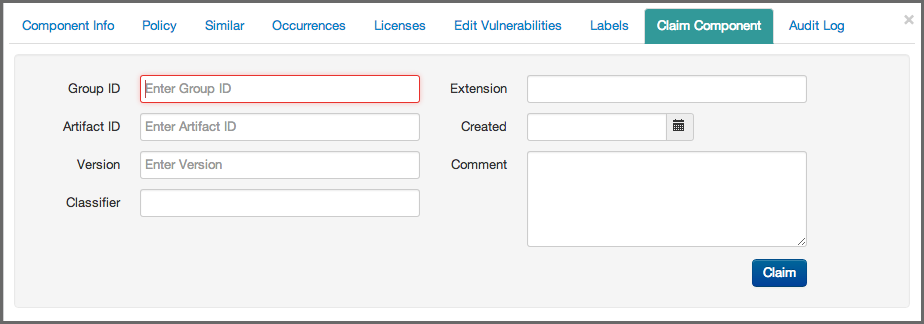
sec
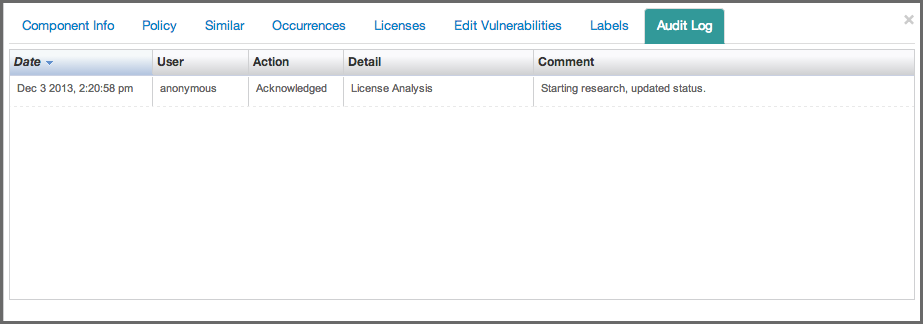
Audit Log. When changes are made to the status of a security vulnerability, or the status of a component’s license within the scope of a particular application, that information is recorded in the Audit Log section of the CIP for that component displayed in Figure 4.19, “CIP, Audit”. As is the case for these last few sections, we’ll discuss the Audit Log in greater detail along with our upcoming discussion of Security Vulnerability and License Analysis status.
This overview showed you a basic introduction to what the Application Composition Report provides. While it’s not meant to be an exhaustive description, there are a number of items you should take with you.
The four tabs of the application composition report represent the basic separation of data. You learned about:
- High level overview of four tabs.
- Significance of summary counts.
- Independence of policy, security, and license data.
- Sorting of the components lists
- Searching for specific components.
- Printing a bill of materials.
- Accessing the component information panel CIP
- Overview of CIP sections