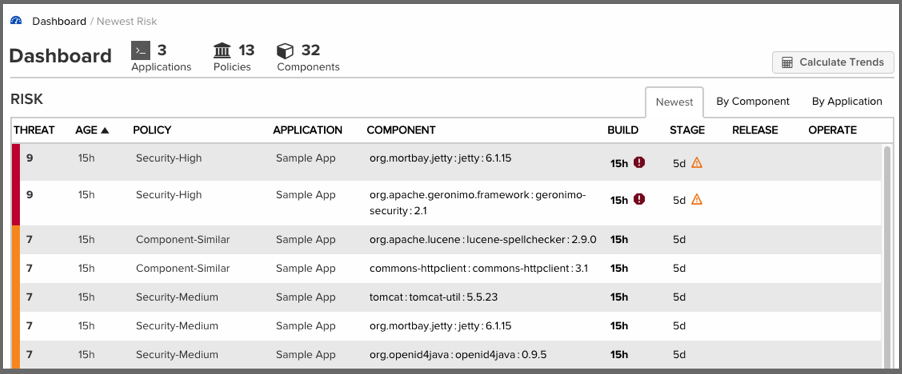
Once logged into the IQ Server, the Dashboard will display by default.
If you are in any other location of the IQ Server, simply click the Dashboard
icon ![]() located in the
header.
located in the
header.
|
|
|
|
The Dashboard is only available via the IQ Server, and only displays information for applications you are permitted to see. This requires that you, at a minimum, be in the Developer role for at least one application. |
Data displayed here is based primarily on violations found during the evaluations of your applications. It is organized into three distinct areas:
|
|
|
|
When navigating the Dashboard, clicking on the breadcrumb link will return you to the most recent tab. |
Filters allow you to adjust the data that is displayed in the Dashboard. While this gives you greater control over what is viewed, in some cases this may limit the display of certain information.
This is most apparent with regard to the display of threat level ranges (Critical, Severe, Moderate, and Low). Based on what filters are set, any columns that display this data may be completely hidden from view.
For example, by default the threat level filter is set to exclude any violations of policies with a threat level less than or equal to 1. Given this, the low threat level column will not be displayed.
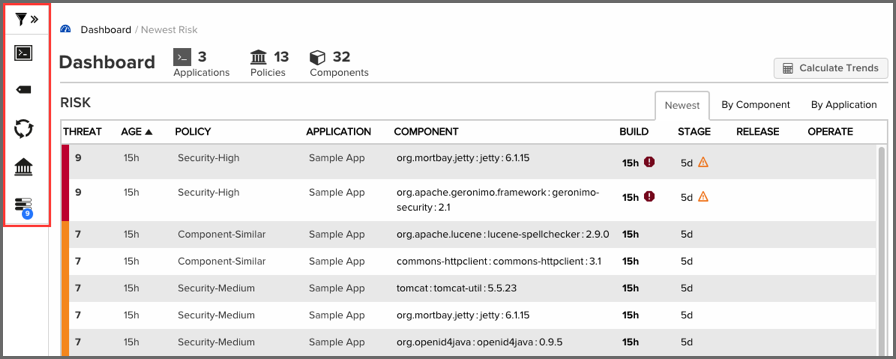
The Filter icon is located to the left of the IQ Server screen, just below
the Sonatype logo. To edit the various filters that are available, click on the
chevron to the right of the Filter icon
![]() . This will cause
the Filter menu to slide out to the right.
. This will cause
the Filter menu to slide out to the right.
|
|
|
|
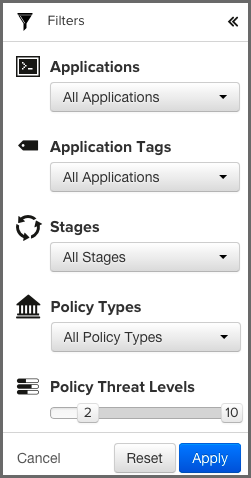
To close the Filter menu, click the chevron next to the Filter icon. |
With the Filter menu open, make selections using the five available filters, and then click the Apply button. Any filters that are not set to All, will have a blue circle, with the total count of selected filter options.
For example if you selected five applications, the Applications filter would have a blue circle with the number five. The same is true with all the filters, including threat level. In the case of the latter, the total number of threat levels selected in the filter, not the actual threat level, is displayed.
To reset the filters, click the Reset button, and then Apply.
|
|
|
|
After exiting the Sonatype Dashboard area and/or logging out, your most recent filters will persist for your account when you return. |
The available filters have been described below.
The policy type filter allows you to select which types of policies you want displayed in the violation lists. Type is assigned automatically based on conditions included within the policy. The following rules are used to determine a policy’s type:
|
|
|
|
A policy can only ever be of one type. In cases where a policy has conditions that meet more than one of the rules above, the order above dictates the type of policy. For example, if a policy has security and license conditions, it would be considered a security type of policy. |
Violations can occur in different stages, and this will likely affect how much attention you decide to give at a particular point in time. Using this filter, you can show violations for a specific stage. The available stages include:
|
|
|
|
Access to stages is limited by your product license, and the filters will reflect this. In addition, when specifying a stage with the filter, those not selected will be hidden from view. |
The Policy Threat Level filter functions as a slider that allows you to select the threat level or a range of threat levels. This corresponds to the threat level of the policy that has been violated.
|
|
|
|
By default, the Policy Threat Level filter has already been set to only display policy violations with a threat greater than or equal to 2. This means only those violations in the Critical, Severe and Moderate threat ranges will be displayed. As a result, the Low threat category column is hidden. |
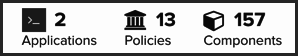
The Dashboard header displays a summary of the data matching the current filter.
While much of the Dashboard focuses on policy violations, the information provided in the dashboard header summary covers all components.
The dashboard header summary shows counts for the number of applications, policies, and components the data in the Dashboard represents, identified by their corresponding icon and text label.
|
|
|
|
In cases where data has been filtered, the counts may not represent all data. |
To the right of the Dashboard header summary is a button titled Calculate Trends, clicking this will open a modal which will retrieve a view of trends for policy violations matching your current filter.
|
|
|
|
This could take some time to calculate depending on the number and size of evaluations that match. |
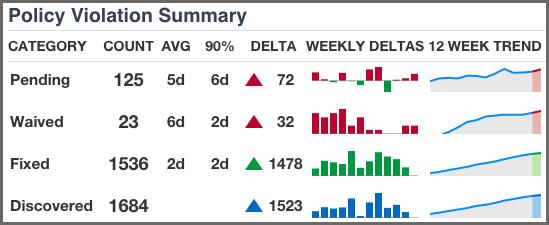
In contrast to the count data, the rest of the Dashboard, including the Policy Summary visualization, is geared towards identifying which components in your applications present risk so you can address them accordingly. This is because understanding how your business is handling risk over time is extremely important. As you are likely already asking, questions such as "How many new violations have been encountered, waived, or fixed," as well as "How many remain unresolved," are just the beginning.
Given this, the main goal of the Policy Summary visualization is to provide a quick, twelve-week look at how risk is entering your applications, and how you are handling that risk.
The Policy Summary area is divided into four categories, with each category having four metrics over a twelve-week period.
These categories and metrics have been described below:
A policy violation that has been Discovered, but not yet Fixed or Waived, is Pending.
|
|
|
|
Reducing the number of pending violations is a critical task. Weekly deltas above the x-axis indicate there were more discovered violations than those fixed; green bars below the x-axis represent more violations were fixed than discovered. |
This represents a count of policy violations that have been waived. This count is not included in Pending or Fixed, but is included in Discovered.
|
|
|
|
For more information on waivers, see the Waivers section of the Application Composition Report chapter. |
A policy violation is Fixed when it no longer exists in any stage.
|
|
|
|
When determining the Fixed state of a component, any filtered stages are not considered. That is, if you exclude a stage where a violation has occurred, the count for fixed may increase even though the violation is still present in the other stage. |
|
|
|
|
It is not uncommon to see discovered violations trend upwards steeply, especially in the early phases of your implementation, and then plateau as you start developing a better component consumption process. Using your mouse to hover over values in the graphs will display the individual values for each week. |