The Highest Risk Violations display is separated into three different views/tabs.
All risk information is based on the state the policy was in at the time of the most recent evaluation, while information regarding the age is taken from the first occurrence of the violation. If policy changes have been made, and a new evaluation has not been conducted, the changes will not be reflected in the currently displayed information.
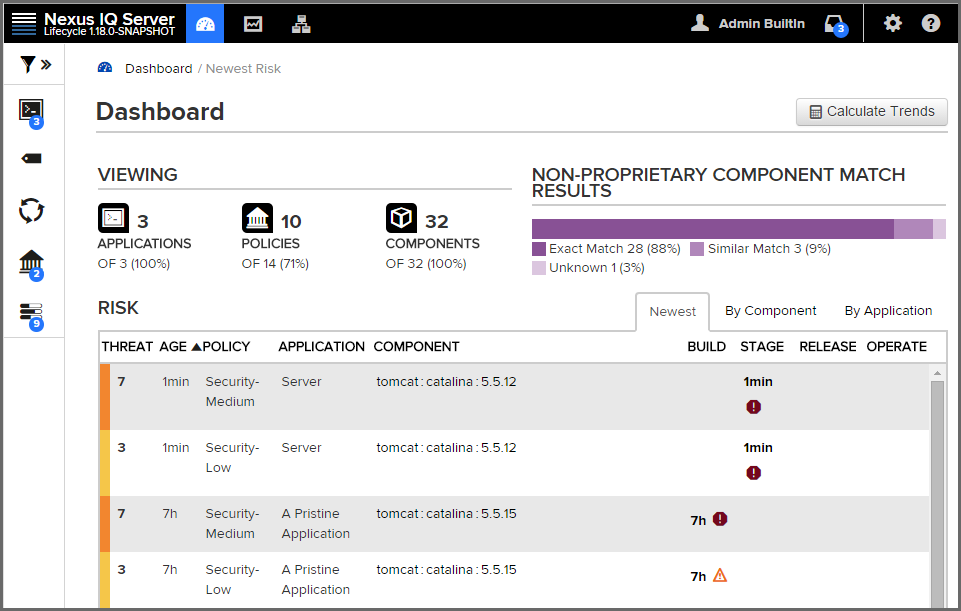
This is the default view for the Dashboard. It displays the first one hundred, newest component violations found in your applications. The data in this view can also be adjusted using the filters, and is organized into a number of columns. These have been described below.
|
|
|
|
A violation is only considered new the first time it is discovered, even if it is found in different stages. For example, if a violation is found at the first of the month during an evaluation at the Build stage, and then again at the end of the month at the Release stage, only the occurrence at the build stage is considered new. |
Each stage is represented by a column. The amount of time that has passed since discovery of the component in violation of a policy will be displayed in the corresponding column. Abbreviations for time is as follows:
If any actions were taken in the stage (i.e. warn or fail), an icon will be displayed. Only the stages which your IQ Server is licensed for will appear.
+ TIP: Clicking on the time stamp for the violation will open the most recent Application Composition Report for the corresponding component and application.
This view displays the first 100 highest risk components based on any filters that have been set and your level of access. Risk is represented in several ranges (Total, Critical, Severe, and Moderate), which corresponds to a color (Black, Red, Orange, Yellow). In addition, shading represents the severity of the risk within a particular column. That is, darker shading indicates the value is more severe relative to the other items in the column.
|
|
|
|
By default only policy violations greater than 1 (i.e. all but low/blue) are displayed and included in the calculations. Given that data excluded by filters is not displayed on the Dashboard, the Low violations column will not be present. This can be modified by setting the Policy Threat Level filter to include violations below these levels (0/1). |
To calculate the total risk for each component, the threat level of all policies the component has violated are added together. In other words, component risk is the sum of policy violation threat levels for the component. A similar calculation is done for each risk range.
Now, this may leave you wondering, "What about the duplication of violations across stages, or even in the same stage?"
Good question.
For all calculations, a violation is only counted once. When there are multiple instances of the same violation, only the most recent occurrence is counted, regardless of stage. Because of this, in cases where a policy has been changed in between evaluations, the violation from the latest evaluation will be included. This will be true, even if the change to the policy included threat level.
Now, let’s take a look at each individual column, which has been described below.
The sum of applications that are affected by a policy violation due to this component.
|
|
|
|
Clicking on this value will open the Component Detail Page. |
|
|
|
|
Remember, if your filters exclude data in any of these categories, this information will not be displayed. |
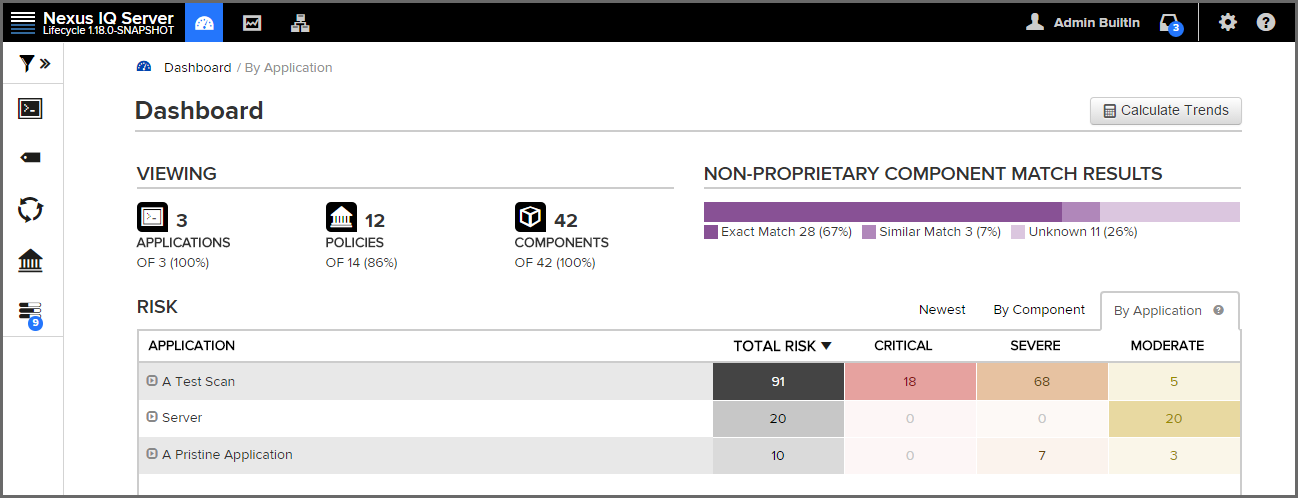
This view displays the first 100 highest risk applications based on any filters that have been set, and your level of access.
|
|
|
|
By default only policy violations greater than 1 (i.e. all but low/blue) are displayed and included in the calculations. Given that data excluded by filters is not displayed on the Dashboard, the Low violations column will not be present. This can be modified by setting the Policy Threat Level filter to include violations below these levels (0/1). |
Like a component, risk for an application is associated with the threat level of a policy. In the case of application risk, it is the sum of policy threat levels that correspond to unique policy violations for the components in an application.
This produces a total count by stage. The unique occurrences are then added together to create the total risk of an application. Put another way, application risk is the sum of all unique policy violation threat levels across all stages and policies the application is evaluated against.
Similar to the By Component view, for all calculations, a violation is only counted once. When there are multiple instances of the same violation, only the most recent violation is counted, regardless of stage. Because of this, in cases where a policy has been changed in between evaluations, only the violation from the most latest evaluation will be included. This will be true, even if the change to the policy included threat level.
Given the logic behind the calculation, risk is then broken down into five columns (six when low violations are included). Each application record can also be expanded to see the risk breakdown by stage.
|
|
|
|
Click on the stage name to see the most recent Application Composition Report for the corresponding application and stage. |
For additional detail, take a look at the descriptions of each column below.
|
|
|
|
Remember, if your filters exclude data in any of these categories, this information will not be displayed. |