
Sonatype CLM Server - Dashboard
As components are used across various applications, and then evaluated with Sonatype CLM, it is very likely some of those components will violate your policies. When violations occur, this creates risk. The Component Detail page presents the known coordinates for the component and then below this, all violations that have been found, organized by application. In addition, risk information for each component is provided.
Clicking on the icon to the top left of each application name will expand or collapse the detail for all policy violations related to the corresponding component and application.
Similar to previous views, separate columns display pertinent information related to the component and violations associated with each application it is used in. These have been described in additional detail below.
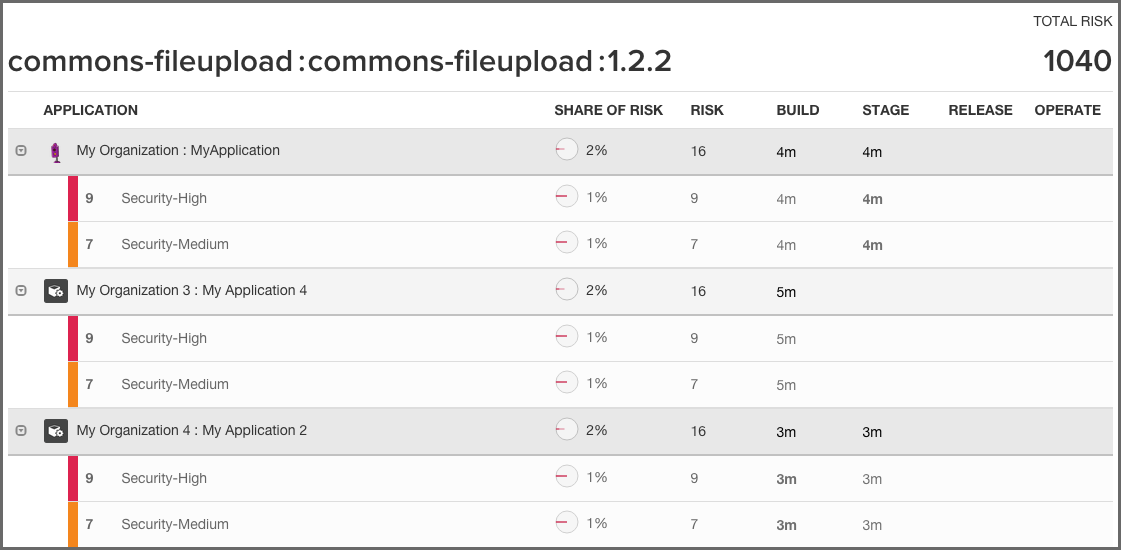
- Application
- The name of application, preceded by its parent organization.
- Share of Risk
-
The share of risk is displayed as a total for the application, as well as a breakdown for each violated policy.
- For the Application
- This is the percentage of risk for the displayed component in relation to a specific application. It is calculated by taking the sum of the threat levels for policies an application is evaluated against (and the component has violated), and then dividing by the sum of threat levels for all policies violated across all applications displayed.
- For the Policy
- This is the percentage of risk for a particular policy violation as it relates to the total risk for the component. It is calculated by taking the threat level of the violated policy, and dividing it by the sum of the threat levels for all violated policies for the displayed component and applications.
- Risk
- Risk represents the sum of the threat levels for the policies the component has violated.
- CLM Stages
-
The CLM stages follow the four stages that Sonatype CLM employs (Build, Stage (Stage Release), Release, Operate). The amount of time that has passed since discovery of the component in violation of a policy will be displayed in the corresponding column and row. Abbreviations for time is as follows:
- min = minute
- h = hour
- d = day
- m = month
- y = year
In addition, if any actions were taken in the stage (i.e. warn or fail), an icon will be displayed.
![[Tip]](images/icons/tip.png)
Clicking on the time stamp for the violation will open the most recent Application Composition Report for the corresponding component and application.