Sonatype CLM Server - Dashboard
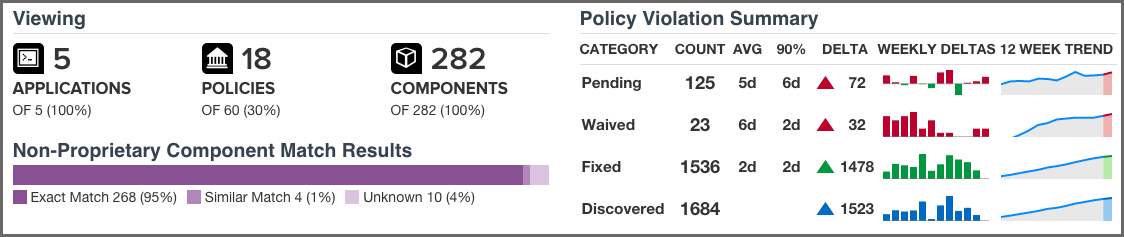
Just below the customizable filters, are two visual representations of the data.
- Viewing
-
While much of the dashboard focuses on policy violations, the information provided in the Viewing area covers all components. There is only one exception, proprietary components. That is, the match results will not include any components that are excluded as a result of your proprietary component settings.
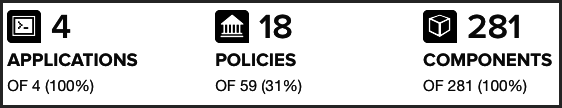
The first display shows counts for the number of applications, policies, and components the data in the dashboard represents, identified by their corresponding icon and text label.
![[Note]](images/icons/note.png)
In cases where data has been filtered, the counts may not represent all data. In these cases, this will display as a percentage less than 100%.
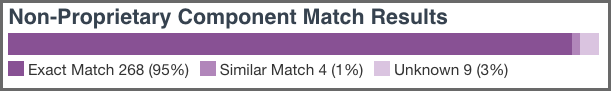
The second displays the non-proprietary component matches.
When reviewing match data, it is important to remember the types of matches that can occur. It may also be a good idea to review the section of the Report User Guide focused on Component Identification. A brief overview is included below.
- Exact Match
- Sonatype CLM has matched a component exactly to the one in your application.
- Similar Match
- Sonatype CLM has found at least one component that may match the component in your application.
- Unknown
-
Sonatype CLM has been unable to identify the component in your application.
In instances where an unknown or similar component has been claimed, it will be considered an exact match.
- Policy Summary
-
In contrast to the count and match data, the rest of the Sonatype CLM Dashboard, including the Policy Summary visualization, is geared towards identifying which components in your applications present risk so you can address them accordingly. This is because understanding how your business is handling risk over time is extremely important. As you are likely already asking, questions such as "How many new violations have been encountered, waived, or fixed," as well as "How many remain unresolved," are just the beginning.
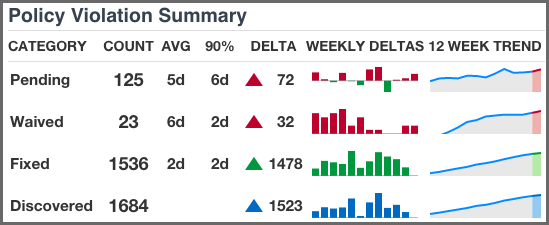
Given this, the main goal of the Policy Summary visualization is to provide a quick, twelve-week look at how risk is entering your applications, and how you are handling that risk.
The Policy Summary area is divided into four categories, with each category having four metrics over a twelve-week period.
These categories and metrics have been described below:
- Policy Summary Categories
-
- Pending
-
A policy violation that has been Discovered, but not yet Fixed or Waived, is Pending.
![[Tip]](images/icons/tip.png)
Reducing the number of pending violations is a critical task with Sonatype CLM. Weekly deltas above the x-axis indicate there were more discovered violations than those fixed; green bars below the x-axis represent more violations were fixed than discovered.
- Waived
-
This represents a count of policy violations that have been waived. This count is not included in Pending or Fixed, but is included in Discovered.
For more information on waivers, see the Waivers Section of the Sonatype CLM Application Composition Report documentation.
- Fixed
-
A policy violation is Fixed when it no longer exists in any Sonatype CLM stage.
When determining the Fixed state of a component, any filtered stages are not considered. That is, if you exclude a stage where a violation has occurred, the count for fixed may increase even though the violation is still present in the other stage.
- Discovered
- A policy violation is considered Discovered when it has been observed for the first time.
- Policy Summary Metrics
-
- Count
- the total (all-time) count for the category.
- AVG
- the average age of violations in the category
- 90%
- indicates 90 percent of violations have been in the category less than this time.
- Delta
- the count for the current week (week twelve), over the first week.
- Weekly Deltas
- the visual representation of each week’s unique delta.
- 12 Week Trend
- the trend over twelve weeks.
It is not uncommon to see discovered violations trend upwards steeply, especially in the early phases of your Sonatype CLM implementation, and then plateau as you start developing a better component consumption process. Using your mouse to hover over values in the graphs will display the individual values for each week.