
The CLM Book - Optimized Component Lifecycle Management with Sonatype CLM
Data displayed in the dashboard is based primarily on violations found during the evaluations of your applications. It is organized into three distinct areas:
- Filters
- Visual Overview
- Highest Risk Violations
|
|
|
|
When navigating the dashboard, clicking on the breadcrumb link will return you to the most recent tab. |
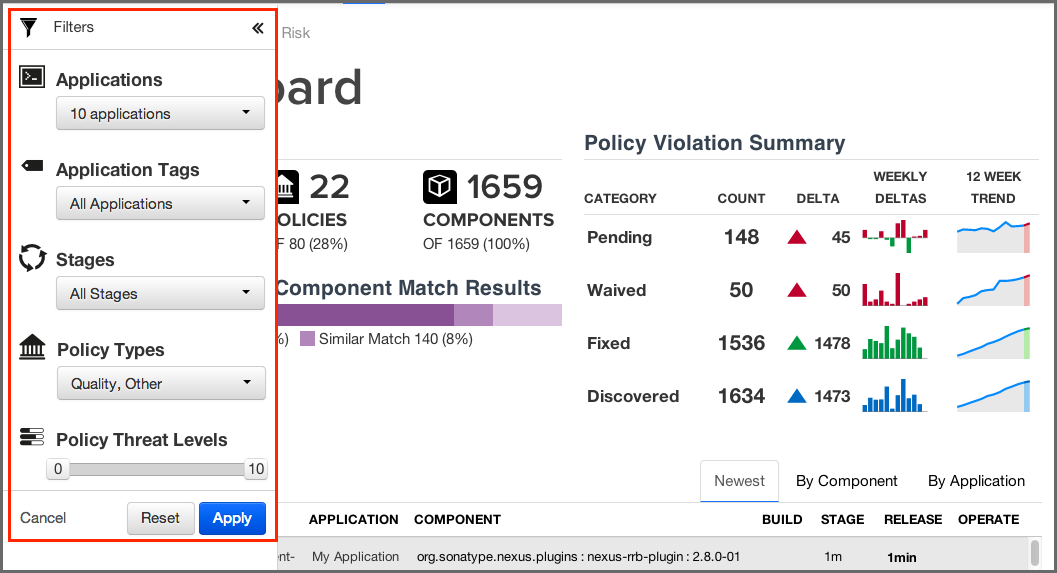
Filters allow you to adjust the data that is displayed in the dashboard. While this gives you greater control over what is viewed, in some cases this may limit the display of certain information.
This is most apparent with regard to the display of threat level ranges (Critical, Severe, Moderate, and Low). Based on what filters are set, any columns that display this data may be completely hidden from view.
For example, by default the threat level filter is set to exclude any violations of policies with a threat level less than or equal to 1. Given this, the low threat level column will not be displayed.
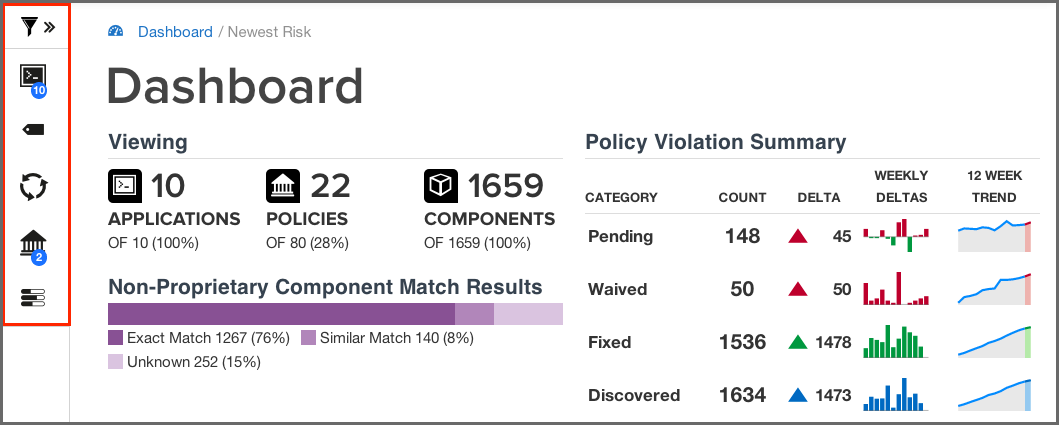
The Filter icon is located to the left of the Sonatype CLM screen, just below
the Sonatype logo. To edit the various filters that are available, click on the
chevron to the right of the Filter icon
![]() . This will cause
the Filter menu to slide out to the right.
. This will cause
the Filter menu to slide out to the right.
|
|
|
|
To close the Filter menu, click the chevron next to the Filter icon. |
With the Filter menu open, make selections using the five available filters, and then click the Apply button. Any filters that are not set to All, will have a blue circle, with the total count of selected filter options.
For example if you selected five applications, the Applications filter would have a blue circle with the number five. The same is true with all the filters, including threat level. In the case of the latter, the total number of threat levels selected in the filter, not the actual threat level, is displayed.
To reset the filters, click the Reset button, and then Apply.
|
|
|
|
After exiting the Sonatype Dashboard area and/or logging out, your most recent filters will persist for your account when you return. |
The available filters have been described below.
- Applications
- The application filter allows you to select which applications you want displayed in the violation lists.
- Application Tags
- The tag filter allows you to isolate violations for applications associated with a particular tag.
- Policy Type
-
The policy type filter allows you to select which types of policies you want displayed in the violation lists. Sonatype CLM automatically assigns type based on conditions included within the policy. The following rules are used to determine a policy’s type:
- Security
- if there are any security conditions, it is considered a security type policy.
- License
- if there are any license conditions, it is considered a license type policy.
- Quality
- if there are any age or popularity conditions, it is considered a quality type policy.
- Other
- if there are any conditions not mentioned above, it is considered an other type policy.
![[Note]](images/icons/note.png)
A policy can only ever be of one type. In cases where a policy has conditions that meet more than one of the rules above, the order above dictates the type of policy. For example, if a policy has security and license conditions, it would be considered a security type of policy.
- Stages
-
Violations can occur in different stages, and this will likely affect how much attention you decide to give at a particular point in time. Using this filter, you can show violations for a specific stage. The available stages include:
- Build
- Stage Release
- Release
- Operate
Access to stages is limited by your product license, and the filters will reflect this. In addition, when specifying a stage with the filter, those not selected will be hidden from view.
- Policy Threat Levels
-
The Policy Threat Level filter functions as a slider that allows you to select the threat level or a range of threat levels. This corresponds to the threat level of the policy that has been violated.
By default, the Policy Threat Level filter has already been set to only display policy violations with a threat greater than or equal to 2. This means only those violations in the Critical, Severe and Moderate threat ranges will be displayed. As a result, the Low threat category column is hidden.
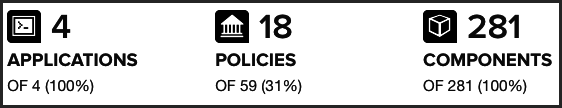
Just below the customizable filters, are two visual representations of the data.
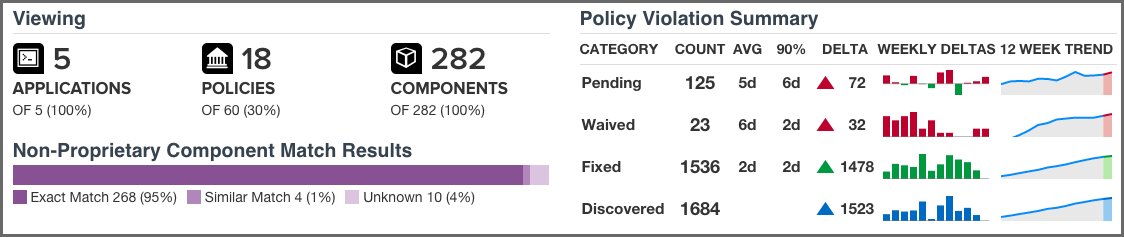
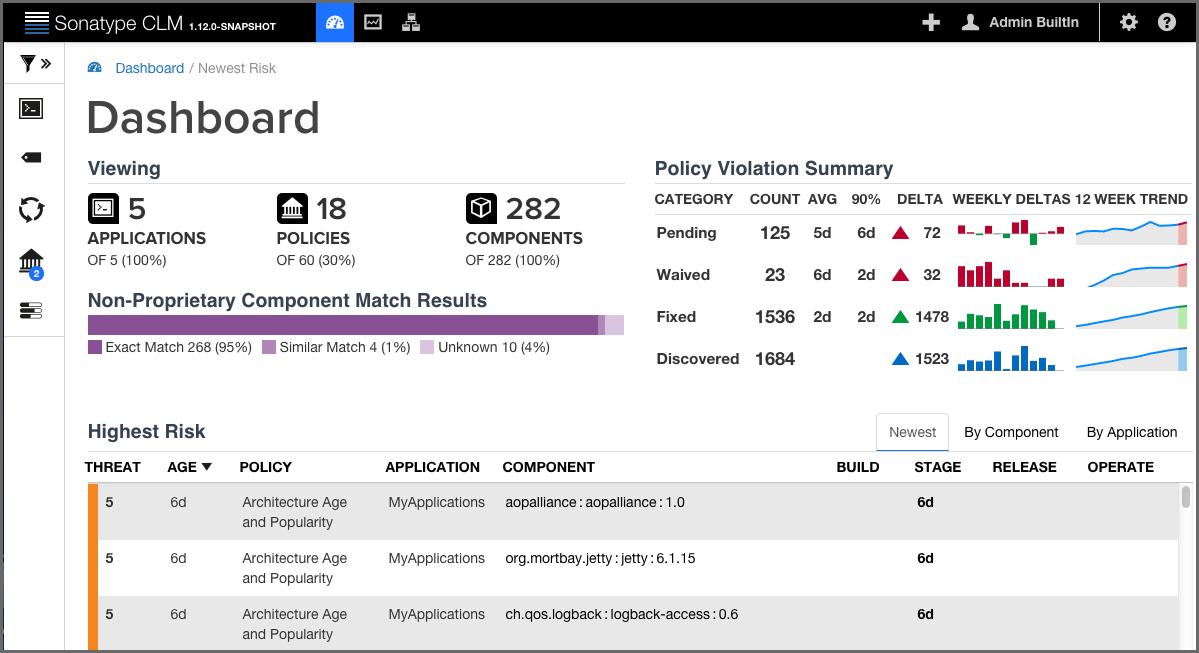
- Viewing
-
While much of the dashboard focuses on policy violations, the information provided in the Viewing area covers all components. There is only one exception, proprietary components. That is, the match results will not include any components that are excluded as a result of your proprietary component settings.
The first display shows counts for the number of applications, policies, and components the data in the dashboard represents, identified by their corresponding icon and text label.
In cases where data has been filtered, the counts may not represent all data. In these cases, this will display as a percentage less than 100%.
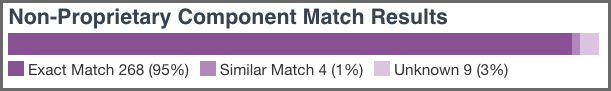
The second displays the non-proprietary component matches.
When reviewing match data, it is important to remember the types of matches that can occur. It may also be a good idea to review the section of the Report User Guide focused on Component Identification. A brief overview is included below.
- Exact Match
- Sonatype CLM has matched a component exactly to the one in your application.
- Similar Match
- Sonatype CLM has found at least one component that may match the component in your application.
- Unknown
-
Sonatype CLM has been unable to identify the component in your application.
In instances where an unknown or similar component has been claimed, it will be considered an exact match.
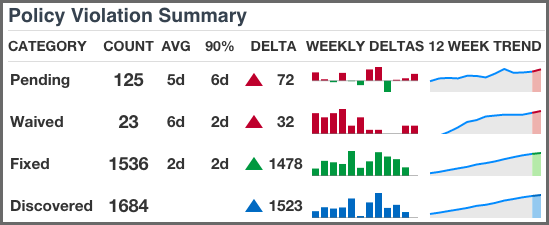
- Policy Summary
-
In contrast to the count and match data, the rest of the Sonatype CLM Dashboard, including the Policy Summary visualization, is geared towards identifying which components in your applications present risk so you can address them accordingly. This is because understanding how your business is handling risk over time is extremely important. As you are likely already asking, questions such as "How many new violations have been encountered, waived, or fixed," as well as "How many remain unresolved," are just the beginning.
Given this, the main goal of the Policy Summary visualization is to provide a quick, twelve-week look at how risk is entering your applications, and how you are handling that risk.
The Policy Summary area is divided into four categories, with each category having four metrics over a twelve-week period.
These categories and metrics have been described below:
- Policy Summary Categories
-
- Pending
-
A policy violation that has been Discovered, but not yet Fixed or Waived, is Pending.
![[Tip]](images/icons/tip.png)
Reducing the number of pending violations is a critical task with Sonatype CLM. Weekly deltas above the x-axis indicate there were more discovered violations than those fixed; green bars below the x-axis represent more violations were fixed than discovered.
- Waived
-
This represents a count of policy violations that have been waived. This count is not included in Pending or Fixed, but is included in Discovered.
For more information on waivers, see the Waivers Section of the Sonatype CLM Application Composition Report documentation.
- Fixed
-
A policy violation is Fixed when it no longer exists in any Sonatype CLM stage.
When determining the Fixed state of a component, any filtered stages are not considered. That is, if you exclude a stage where a violation has occurred, the count for fixed may increase even though the violation is still present in the other stage.
- Discovered
- A policy violation is considered Discovered when it has been observed for the first time.
- Policy Summary Metrics
-
- Count
- the total (all-time) count for the category.
- AVG
- the average age of violations in the category
- 90%
- indicates 90 percent of violations have been in the category less than this time.
- Delta
- the count for the current week (week twelve), over the first week.
- Weekly Deltas
- the visual representation of each week’s unique delta.
- 12 Week Trend
- the trend over twelve weeks.
It is not uncommon to see discovered violations trend upwards steeply, especially in the early phases of your Sonatype CLM implementation, and then plateau as you start developing a better component consumption process. Using your mouse to hover over values in the graphs will display the individual values for each week.
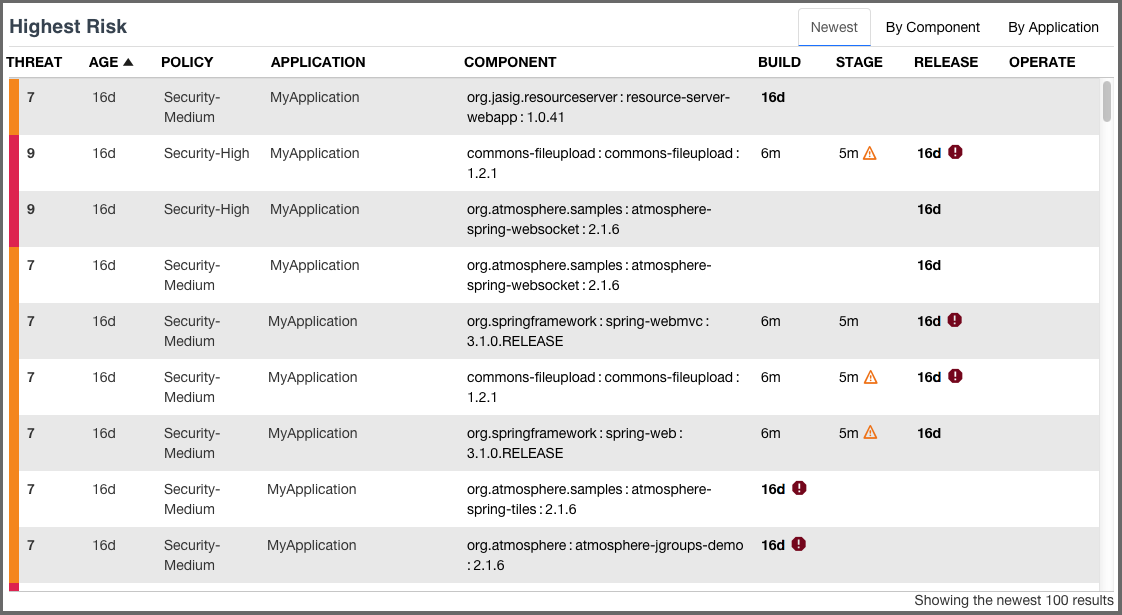
The Highest Risk Violations display is separated into three different views/tabs.
- Newest
- By Component
- By Application
All risk information is based on the state the policy was in at the time of the most recent evaluation, while information regarding the age is taken from the first occurrence of the violation. If policy changes have been made, and a new evaluation has not been conducted, the changes will not be reflected in the currently displayed information.
This is the default view for the dashboard. It displays the first one hundred, newest component violations found in your applications. The data in this view can also be adjusted using the filters, and is organized into a number of columns. These have been described below.
|
|
|
|
A violation is only considered new the first time it is discovered, even if it is found in different stages. For example, if a violation is found at the first of the month during an evaluation at the Build stage, and then again at the end of the month at the Release stage, only the occurrence at the build stage is considered new. |
- Threat
- The assigned threat level of the violated policy.
- Age
- Displays the age of the violation based on the most recent date it occurred.
- Policy
- The name of the policy violated.
- Application
- The name of the application the component violating the policy was found in.
- Component
- The identifying information for a component. For known components, all available coordinate information will be displayed, while unknown components will have the filename. Clicking on the component will display the Component Detail Page.
- CLM Stages
-
The CLM stages follow the four stages that Sonatype CLM employs (Build, Stage (Stage Release), Release, Operate). The amount of time that has passed since discovery of the component in violation of a policy will be displayed in the corresponding column and row. Abbreviations for time is as follows:
- min = minute
- h = hour
- d = day
- m = month
- y = year
If any actions were taken in the stage (i.e. warn or fail), an icon will be displayed. Only the stages which your CLM server is licensed for will appear.
+ TIP: Clicking on the time stamp for the violation will open the most recent Application Composition Report for the corresponding component and application.
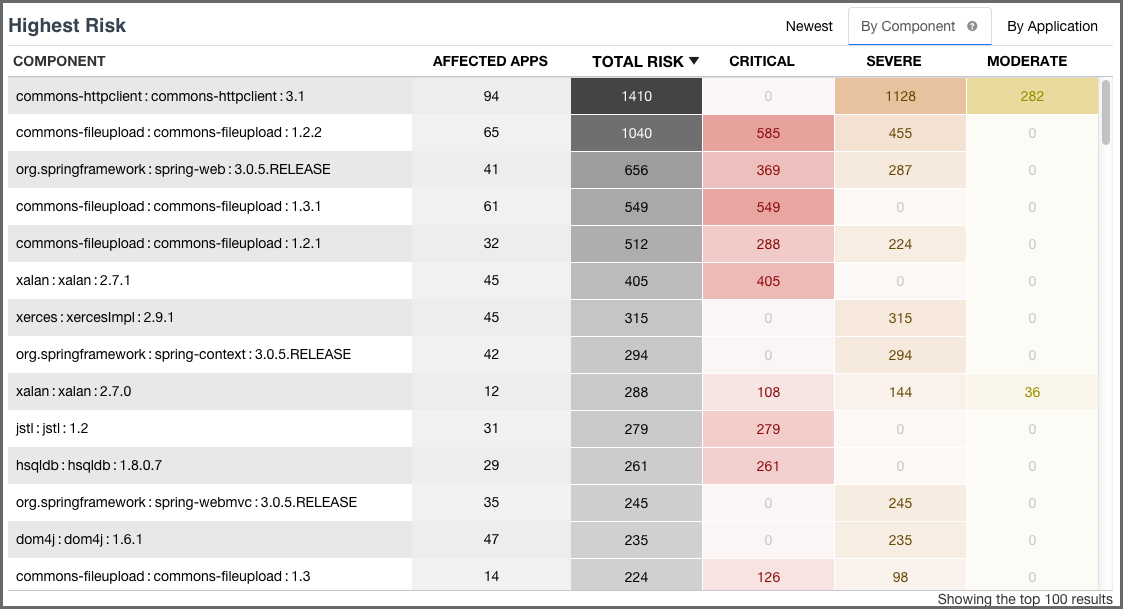
This view displays the first 100 highest risk components based on any filters that have been set and your level of access. Risk is represented in several ranges (Total, Critical, Severe, and Moderate), which corresponds to a color (Black, Red, Orange, Yellow). In addition, shading represents the severity of the risk within a particular column. That is, darker shading indicates the value is more severe relative to the other items in the column.
|
|
|
|
By default only policy violations greater than 1 (i.e. all but low/blue) are displayed and included in the calculations. Given that data excluded by filters is not displayed on the dashboard, the Low violations column will not be present. This can be modified by setting the Policy Threat Level filter to include violations below these levels (0/1). |
To calculate the total risk for each component, the threat level of all policies the component has violated are added together. In other words, component risk is the sum of policy violation threat levels for the component. A similar calculation is done for each risk range.
Now, this may leave you wondering, "What about the duplication of violations across stages, or even in the same stage?"
Good question.
For all calculations, a violation is only counted once. When there are multiple instances of the same violation, only the most recent occurrence is counted, regardless of stage. Because of this, in cases where a policy has been changed in between evaluations, the violation from the latest evaluation will be included. This will be true, even if the change to the policy included threat level.
Now, let’s take a look at each individual column, which has been described below.
- Component
- The identifying information for a component. For known components, all available coordinate information will be displayed, while unknown components will have the filename. Clicking on the component will display the Component Detail Page.
- Affected Apps
-
The sum of applications that are affected by a policy violation due to this component.
Clicking on this value will open the Component Detail Page.
- Total Risk
- The sum of the threat level for each policy the component has violated. In cases where the same violation is found in multiple stages, only the newest violation is included in this total.
- Critical
- The sum of the component’s policy violations with a threat level of eight or higher.
- Severe
- The sum of the component’s policy violations with a threat level higher than three, but less than eight.
- Moderate
- The sum of the component’s policy violations with a threat level higher than one, but less than four.
- Low
- The sum of the component’s policy violations with a threat level of one.
|
|
|
|
Remember, if your filters exclude data in any of these categories, this information will not be displayed. |
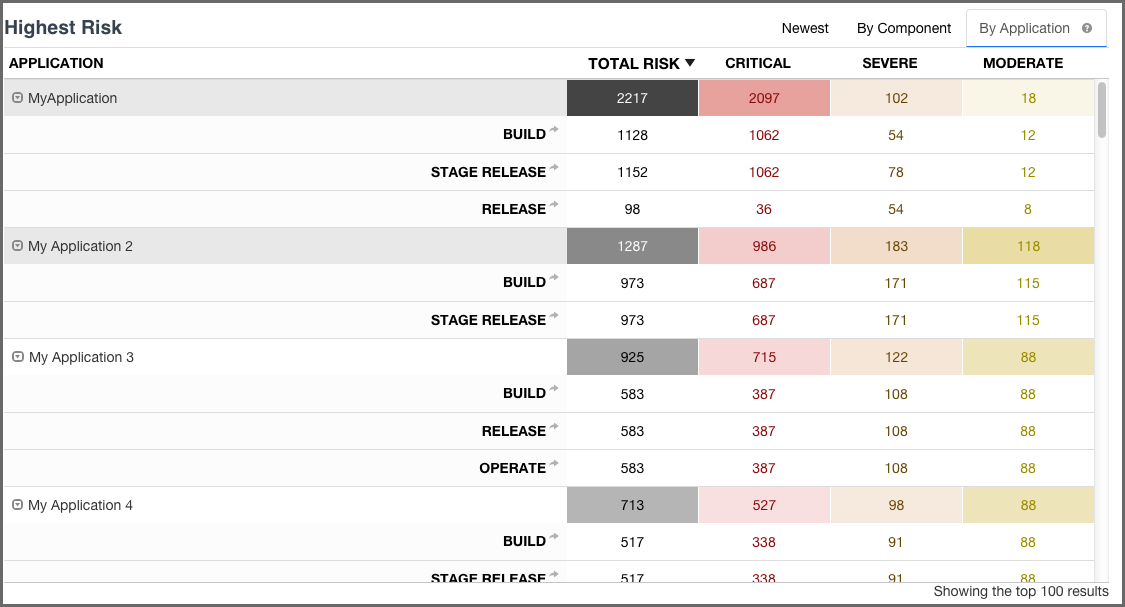
This view displays the first 100 highest risk applications based on any filters that have been set, and your level of access.
|
|
|
|
By default only policy violations greater than 1 (i.e. all but low/blue) are displayed and included in the calculations. Given that data excluded by filters is not displayed on the dashboard, the Low violations column will not be present. This can be modified by setting the Policy Threat Level filter to include violations below these levels (0/1). |
Like a component, risk for an application is associated with the threat level of a policy. In the case of application risk, it is the sum of policy threat levels that correspond to unique policy violations for the components in an application.
This produces a total count by stage. The unique occurrences are then added together to create the total risk of an application. Put another way, application risk is the sum of all unique policy violation threat levels across all stages and policies the application is evaluated against.
Similar to the By Component view, for all calculations, a violation is only counted once. When there are multiple instances of the same violation, only the most recent violation is counted, regardless of stage. Because of this, in cases where a policy has been changed in between evaluations, only the violation from the most latest evaluation will be included. This will be true, even if the change to the policy included threat level.
Given the logic behind the calculation, risk is then broken down into five columns (six when low violations are included). Each application record can also be expanded to see the risk breakdown by stage.
|
|
|
|
Click on the stage name to see the most recent Application Composition Report for the corresponding application and stage. |
For additional detail, take a look at the descriptions of each column below.
- Application
- The name of the application is displayed here. Click the expand icon (the small triangle icon), to display the results for each stage.
- Total Risk
- The sum of the threat levels for all policy violations in the application. In cases where the same violation is found in multiple stages, only one violation is included in this risk score.
- Critical
- The sum of policy violations in the application with a threat level of eight or higher.
- Severe
- The sum of policy violations in the application with a threat level higher than three, but less than eight.
- Moderate
- The sum of policy violations in the application with a threat level higher than one, but less than four.
- Low
- The sum of the component’s policy violations with a threat level of one.
|
|
|
|
Remember, if your filters exclude data in any of these categories, this information will not be displayed. |