A User Guide to Reports in Sonatype CLM
The Summary tab is always the first section of the report displayed. It is broken into three sections:
- Scope of Analysis
-
This section shows counts, giving you an idea of the volume of components that were found during the scan. It also gives a breakdown of those that were identified, including a specific percentage that is represented by open source components. In addition to these numbers, you will also see:
- A count of components with policy violations, displayed by threat level. Only the most severe violation for each component is counted.
- The total number of security alerts found, and the number of affected components.
- The total number of license alerts. Each license alert corresponds to a single component.
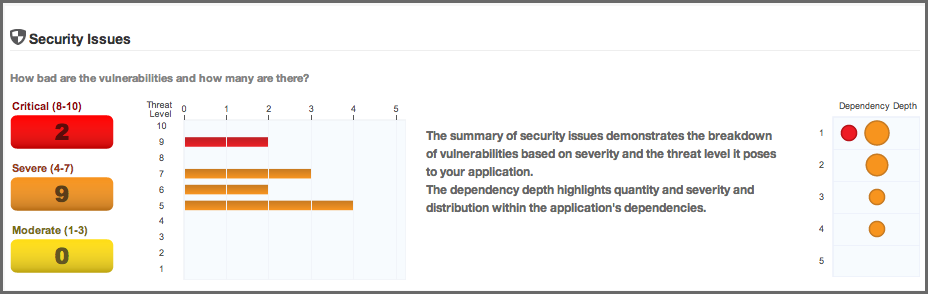
- Security Issues
- The Security Issues section provides three visualizations. The first visualization displays the number of security issues by their particular Common Vulnerability Scoring System CVSS score, breaking the issues into three threat levels - Critical, Severe and Moderate.
Next to this raw count, the same numbers are represented in a bar graph to help distinguish the relative impact for each threat level.
Finally, a dependency depth chart shows where the security issues occur, relative to how many there are, indicated by the size of the circles, as well as what level of dependency they are found in.
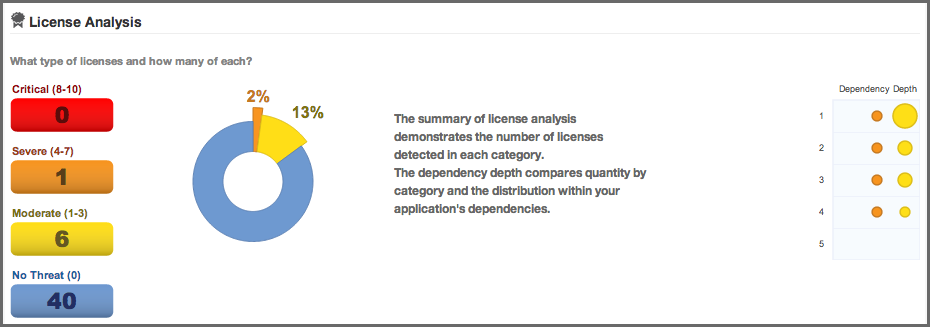
- License Analysis
- As with Security, the License Analysis section breaks the data into four threat level categories. However, these threat levels do not come from an external source, but rather the user-configurable license threat groups that are managed via the CLM Server.
There are four threat level categories:
- Critical (Copyleft)
- Severe (Non-Standard)
- Moderate (Weak Copyleft)
- No Threat (Liberal)
These categories used in the report are static and not not configurable.
The first counts that are displayed represent the total number of licenses found in each threat level. Next to this list, a graph indicates percentage of licenses in each threat level category, compared to the total number of licenses found. Finally, a dependency depth chart indicates the volume of licenses found at each dependency level, as well as the color corresponding to the threat level.